

US Dollar Index Price Forecast: Treads water above nine-day EMA support near 108.00

- Iranian military drones targeted US Fifth Fleet in Bahrain in response to southern US strikes
- Gold plummets below $4,200 as US‑Iran tensions spur hawkish rate bets ahead of US CPI
- Gold declines below $4,500 on stalled US-Iran ceasefire talks, US NFP data looms
- SpaceX Listing Imminent. Funds Flood Into SpaceX On-Chain Tokens, Bitcoin Rebound Momentum May Be Weakened
- US May CPI Preview: Rising Inflation May Push Up Fed Rate Hike Expectations, How Will US Stocks, Dollar, Gold React?
- Gold Drops Below $4,300 Erasing Year-to-Date Gains. This Week’s CPI May Ignite Rate Hike Expectations Will Gold Still Rise in 2026?

The US Dollar Index consolidates as the 14-day RSI) suggests a neutral market stance with no buying or selling pressure.
A break below the 108.00 level would lead the index toward its eight-week low of 106.97.
The primary barrier appears around the descending channel’s upper boundary at 109.70 level.
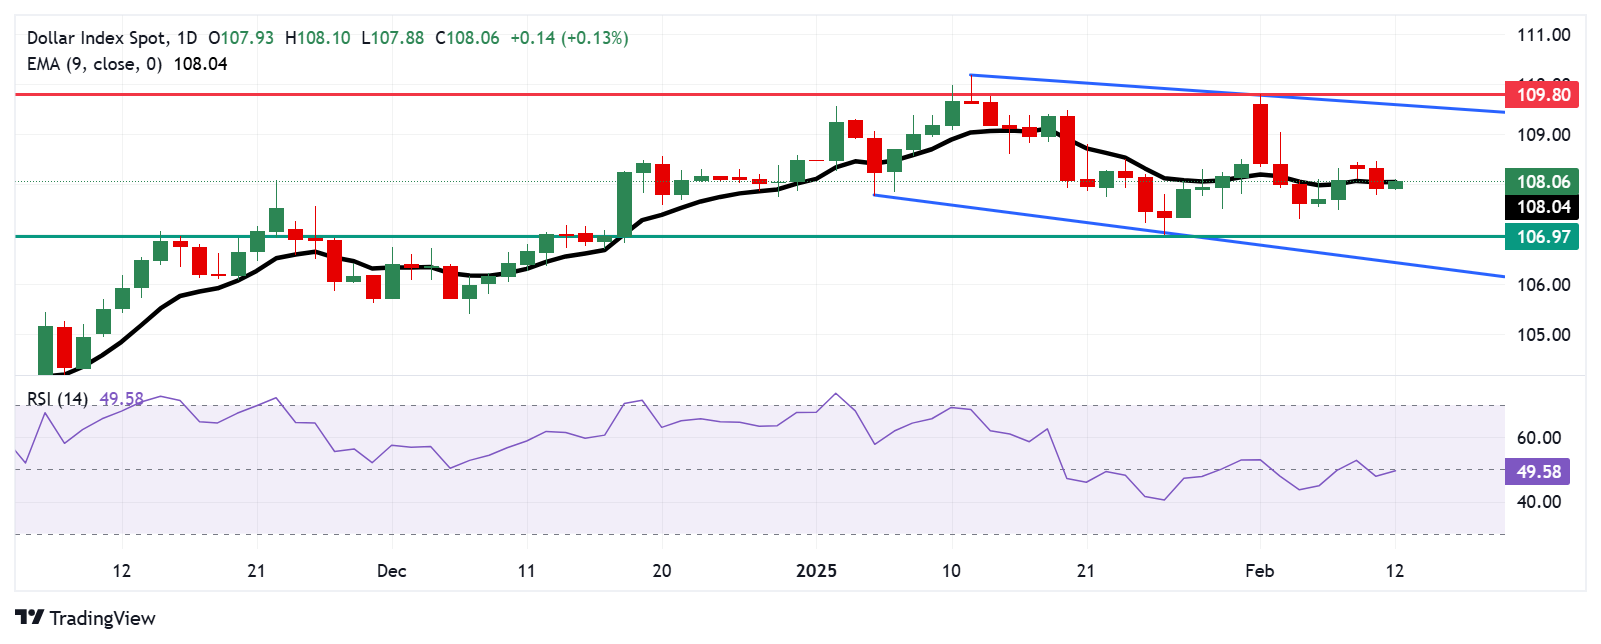
The US Dollar Index (DXY) recovers its losses from the previous two sessions, trading around 108.10 during Asian hours on Wednesday. A review of the daily chart suggests a bearish bias as the index consolidates within the descending channel pattern.
However, the 14-day Relative Strength Index (RSI) is hovering around the 50 level, indicating a neutral market stance with no significant buying or selling pressure. Further moves would offer a clear directional trend. Furthermore, the US Dollar Index remains positioned on the nine-day Exponential Moving Average (EMA), confirming the short-term price momentum is neutral.
On the downside, the DXY tests the nine-day EMA at 108.04 level, aligned with the psychological level of 108.00. A break below the latter would weaken the short-term price momentum and lead the index to navigate the region around its eight-week low of 106.97, which was recorded on January 27. Further depreciation below this level could strengthen the bearish bias, pushing the index toward the lower boundary of the descending channel at 106.50.
Regarding resistance, the DXY could explore the area around the upper boundary of the descending channel at 109.70 level, followed by the four-week high of 109.80, last tested on February 3.
US Dollar Index: Daily Chart
US Dollar PRICE Today
The table below shows the percentage change of US Dollar (USD) against listed major currencies today. US Dollar was the strongest against the Japanese Yen.
| USD | EUR | GBP | JPY | CAD | AUD | NZD | CHF | |
|---|---|---|---|---|---|---|---|---|
| USD | 0.04% | -0.01% | 0.66% | 0.05% | 0.09% | 0.05% | -0.02% | |
| EUR | -0.04% | -0.05% | 0.62% | 0.01% | 0.04% | 0.01% | -0.06% | |
| GBP | 0.00% | 0.05% | 0.63% | 0.07% | 0.09% | 0.06% | -0.01% | |
| JPY | -0.66% | -0.62% | -0.63% | -0.59% | -0.56% | -0.61% | -0.67% | |
| CAD | -0.05% | -0.01% | -0.07% | 0.59% | 0.03% | -0.01% | -0.08% | |
| AUD | -0.09% | -0.04% | -0.09% | 0.56% | -0.03% | -0.04% | -0.11% | |
| NZD | -0.05% | -0.01% | -0.06% | 0.61% | 0.00% | 0.04% | -0.07% | |
| CHF | 0.02% | 0.06% | 0.01% | 0.67% | 0.08% | 0.11% | 0.07% |
The heat map shows percentage changes of major currencies against each other. The base currency is picked from the left column, while the quote currency is picked from the top row. For example, if you pick the US Dollar from the left column and move along the horizontal line to the Japanese Yen, the percentage change displayed in the box will represent USD (base)/JPY (quote).
Read more
* The content presented above, whether from a third party or not, is considered as general advice only. This article should not be construed as containing investment advice, investment recommendations, an offer of or solicitation for any transactions in financial instruments.


