

Market Meltdown: BTC, ETH, and XRP Capitulate as Bears Seize Control

- Trump's Account May Contain BTC. US President Proposes Another Bitcoin Policy, Just Another Political Talk Show?
- Gold declines as Trump scraps Iran memorandum, markets await Fed minutes
- US President Trump: I think MoU with Iran is over
- WTI Crude Oil Price Forecast: US-Iran Conflict Reignites, Will a New Round of Oil Price Rises Begin?
- Gold recovers above $4,100 as traders assess US-Iran conflict
- WTI spikes following fresh US airstrikes on Iran

- Bitcoin surrenders the critical $90,000 stronghold, risking a structural breakdown toward $80,000 as technical anchors fail.
Ethereum's collapse below the $3,017 consolidation floor has shifted focus to the 61.8% Fibonacci defense line at $2,749.
XRP leads the altcoin retreat with a 10% slide under $2, though deeply oversold momentum signals hint at a potential, albeit risky, relief rally.
The crypto market is ending the week in a sea of red, with bearish momentum firmly displacing the recent bullish conviction. Bitcoin, Ethereum, and XRP have all posted significant losses—down roughly 8%, 9%, and 10% respectively—signaling that this is no longer a minor pullback but a test of structural resolve. With BTC losing the $90,000 handle, ETH piercing $2,900, and XRP slipping below $2, the debate has shifted from "buy the dip" to determining where the bleeding finally stops.
Bitcoin: The $90k Fortress Crumbles
Bitcoin’s price action this week has been a study in deteriorating sentiment. After opening on weak footing, BTC sliced through the 61.8% Fibonacci retracement level at $94,253—a key technical anchor derived from the April low ($74,508) to the October all-time high ($126,299). While the bulls initially attempted to defend the psychological $90,000 line, the stalemate broke decisively on Thursday.
The subsequent 5% drop drove prices to a close of $86,637, and by Friday, the asset was languishing near $85,900. This breach forces a painful reassessment for medium-term holders who viewed $90,000 as an inviolable floor. The immediate focus now turns to the $85,000 band. A sustained failure here would likely trigger a cascade of stop-losses, opening the door to the $80,000 round number—a zone that separates a healthy bull-market correction from a more damaging structural reversal.
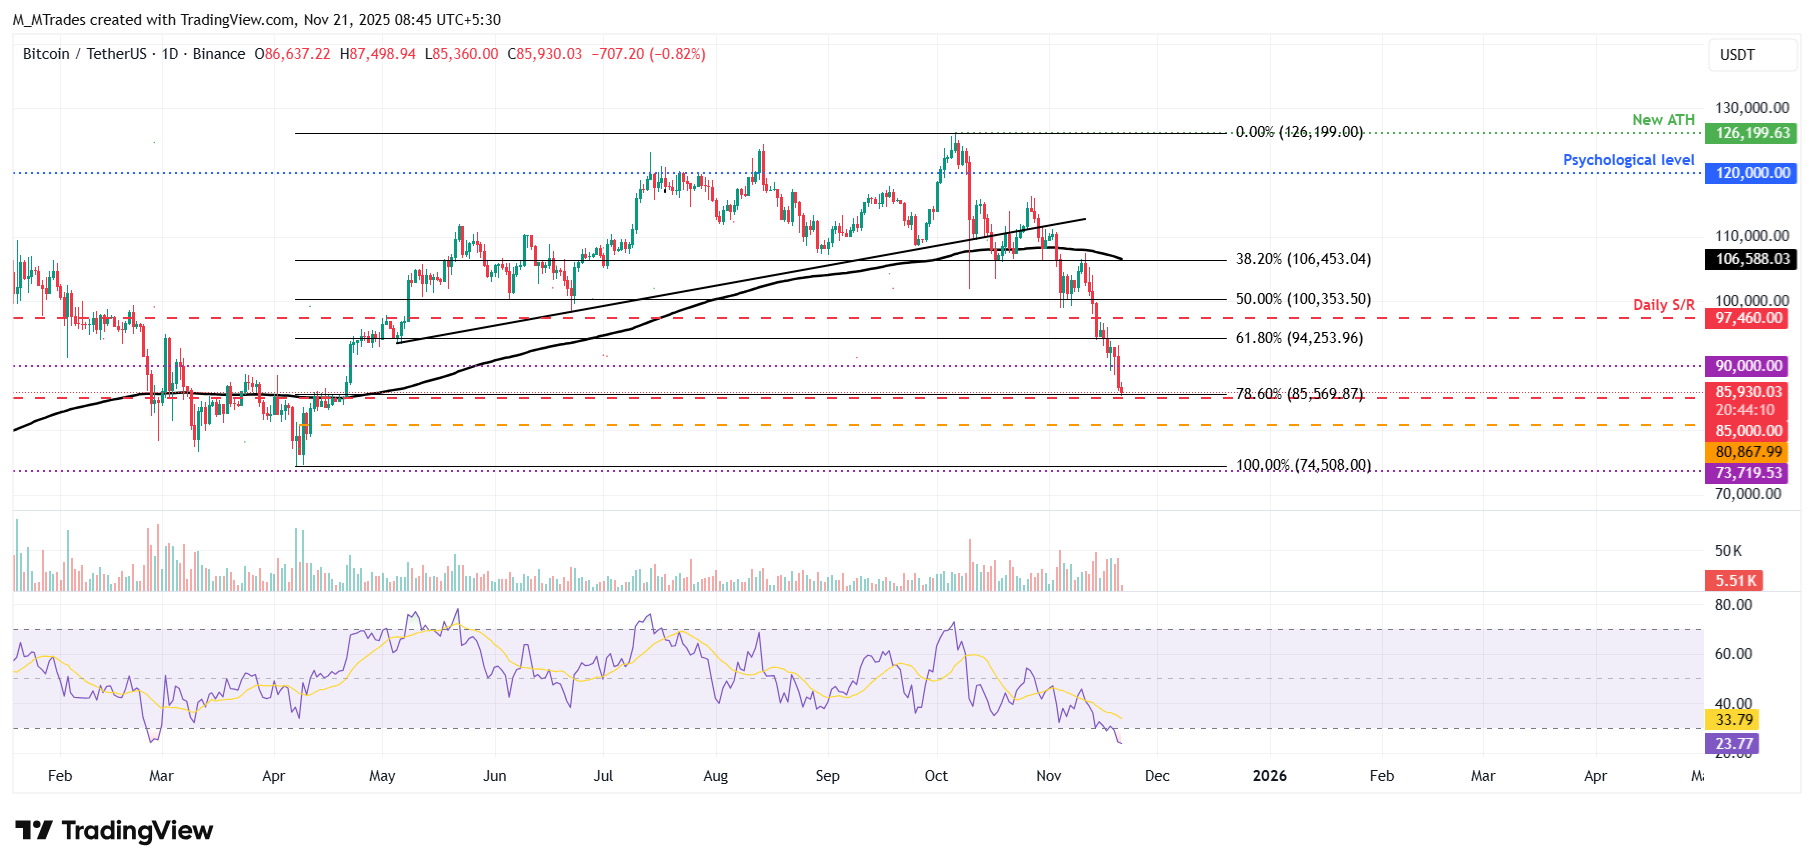
Momentum indicators confirm the severity of the sell-off. The daily Relative Strength Index (RSI) has plunged to 23, a level indicative of extreme oversold conditions. While such readings historically precede sharp counter-trend snaps, they are not a guarantee of a bottom; rather, they reflect a market driven by emotional selling. For bulls to regain any credibility, reclaiming $90,000 is the mandatory first step to trap late shorts.
Ethereum: A Technical Reckoning
Ethereum is grappling with a severe technical breakdown after the market rejected its attempt to reclaim the $3,592 trendline last week. The resulting 14% rejection set the tone, but the true damage occurred on Thursday when ETH closed below $3,017. This level had served as the bedrock of the recent consolidation range; losing it has flipped a key support into a heavy resistance zone.
Trading below $2,791 on Friday, ETH is now in a precarious position. The breakdown has likely forced the capitulation of traders who bought the range lows, turning their former support bids into overhead supply. The next logical defense line for buyers sits at $2,749 (the 61.8% Fibonacci retracement). If this level fails to hold, it would confirm that the market has transitioned from a shallow correction to a deeper search for value.
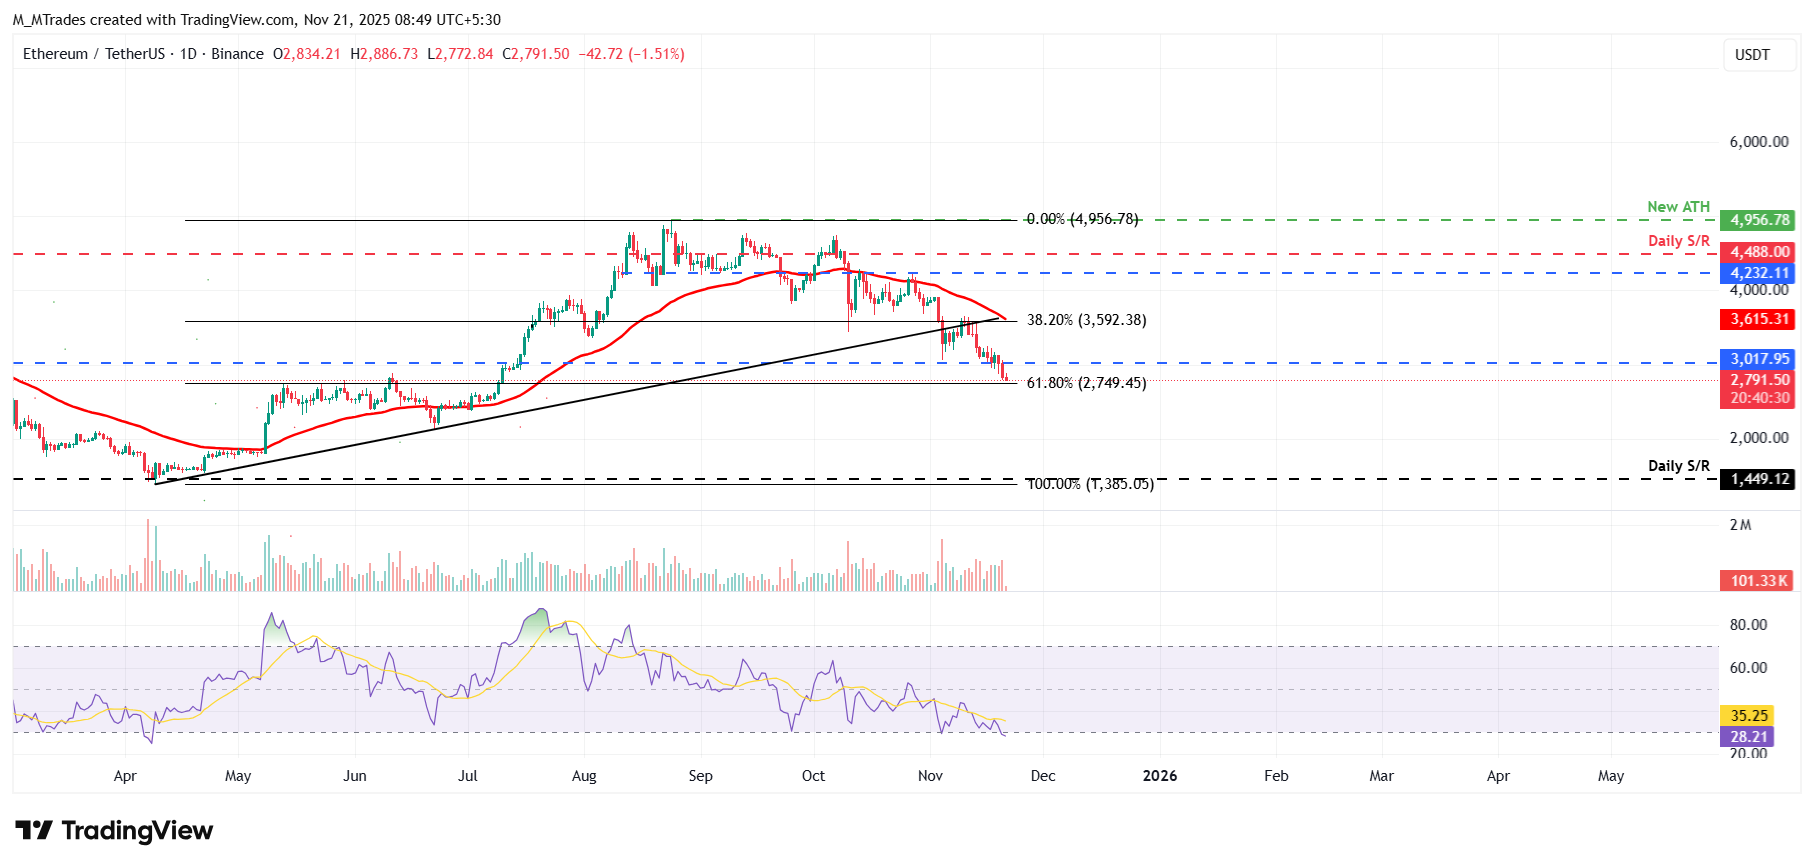
Much like Bitcoin, Ethereum’s momentum is heavily skewed to the downside. The RSI signals a "sell first, ask questions later" environment. However, if a reversal does materialize, the $3,017 level will be the primary battleground. Until that level is reclaimed, the path of least resistance remains lower.
XRP: Leading the Slide
XRP has proven to be the most fragile among the majors this week. The token’s rejection from the 50-day exponential moving average at $2.47 was the catalyst, triggering a rapid 7% decline that extended into a 10% routing by Thursday. Now trading under $1.99, XRP has surrendered the psychological $2.00 mark, a development that often accelerates bearish algorithms.
If the selling pressure persists, the chart points to $1.77 as the next major area of interest for stabilization. This is where longer-term accumulators may step in, looking for volume exhaustion or intraday reversals. However, the immediate trend is undeniably hostile.
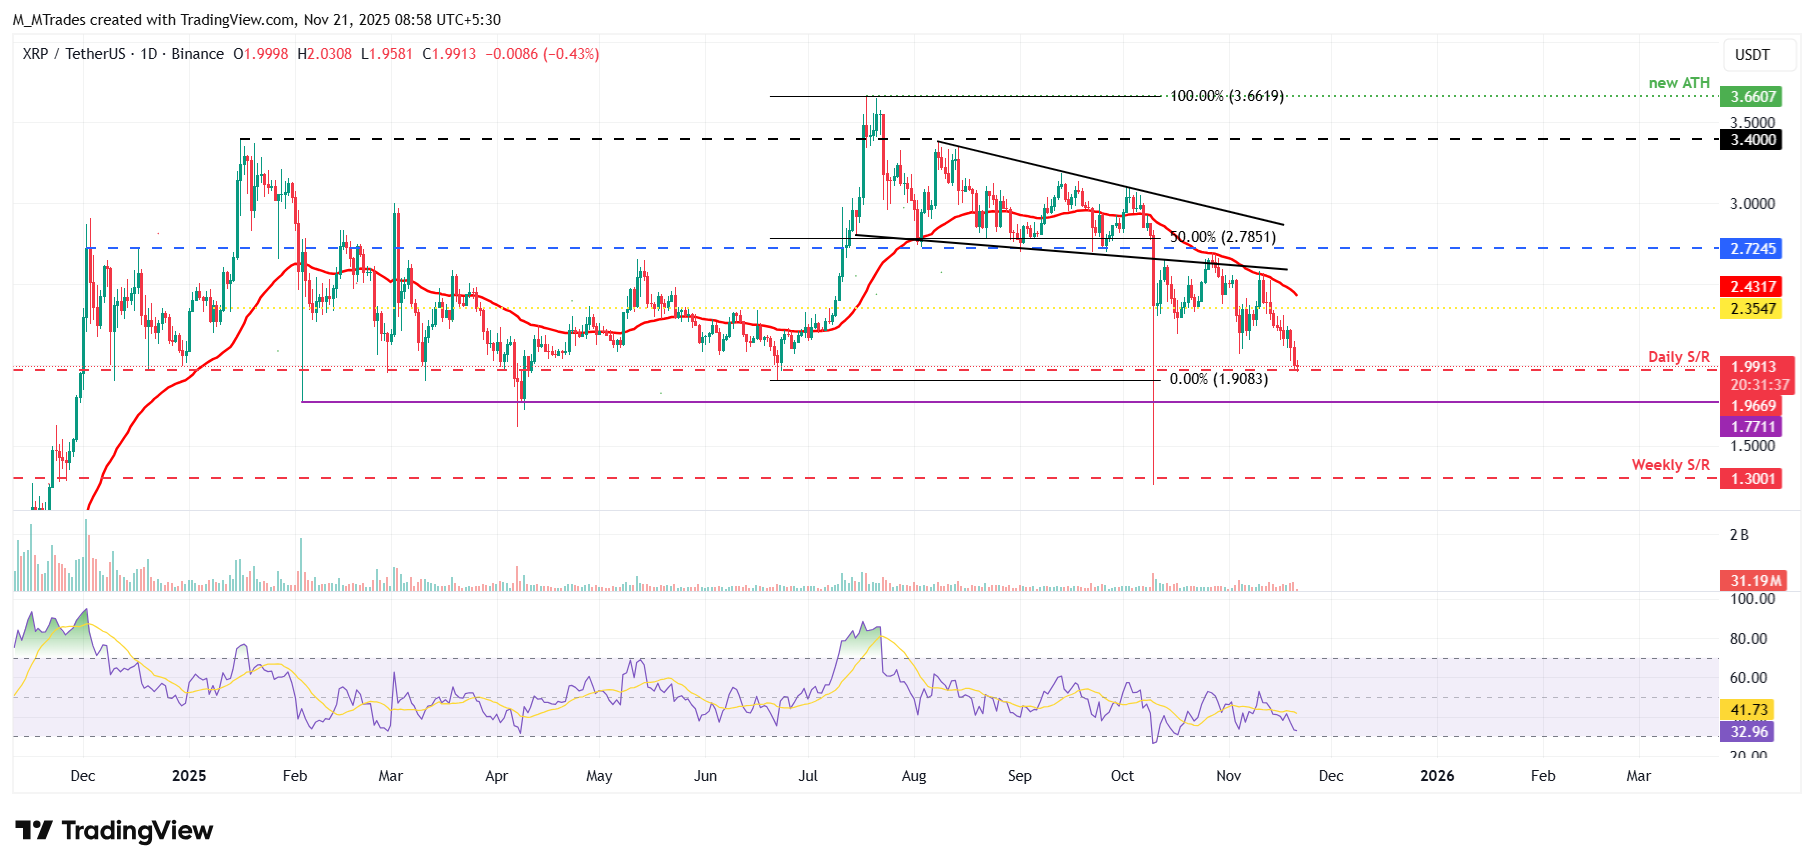
Despite the gloom, the daily RSI reading of 32 suggests the rubber band is stretched tight. The reward-to-risk ratio for initiating fresh short positions here is deteriorating. A snap-back rally would face immediate hurdles at $2.35, but the heavy lifting remains at the 50-day EMA ($2.47). Until XRP can mount a challenge against that dynamic resistance, rallies are likely to be viewed as exit opportunities rather than trend reversals.
Read more
The above content was completed with the assistance of AI and has been reviewed by an editor.


