

Top 3 Price Prediction: Bitcoin, Ethereum, Ripple – BTC, ETH and XRP Look for a Foothold After a Sharp Shakeout

- Trump's Account May Contain BTC. US President Proposes Another Bitcoin Policy, Just Another Political Talk Show?
- Gold declines as Trump scraps Iran memorandum, markets await Fed minutes
- US President Trump: I think MoU with Iran is over
- Gold slides back closer to $4,050 as Iran risks and Fed hike bets boost USD
- WTI Crude Oil Price Forecast: US-Iran Conflict Reignites, Will a New Round of Oil Price Rises Begin?
- Gold recovers above $4,100 as traders assess US-Iran conflict

Bitcoin is trading near $92,600 on Wednesday after dipping to $89,253 earlier in the week, with the $90,000 area acting as the first line of defense.
Ethereum is trying to stabilize around $3,118 after a nearly 14% drop from $3,592, with $3,017 emerging as a decision point for the next leg.
XRP is hovering near $2.21–$2.23 following a 6–7% pullback, caught between resistance at the 50-day EMA at $2.47 and support at $1.96.
Bitcoin (BTC), Ethereum (ETH) and Ripple’s XRP have stopped sliding for the moment, but nobody on either side of the tape is fully convinced this week’s damage is behind them. BTC is back around $92,600 after a brief flush below $90,000. ETH and XRP are sitting on top of nearby support zones, trying to work out whether they’ve seen enough selling to tempt in fresh buyers or whether there is another leg lower in this correction.
Bitcoin finds support around a key psychological level at $90,000
Bitcoin’s week started badly. Price extended its losses by about 2% and slipped underneath the 61.8% Fibonacci retracement level at $94,253, drawn from the April 7 low at $74,508 to the all-time high of $126,299 set on October 6. On Tuesday, sellers pushed BTC down to $89,253 before bids finally showed up around the round $90,000 mark. From there, price bounced into the close at $92,960, and by Wednesday BTC is trading near $92,600.
On a chart, $90,000 is just another level. In traders’ heads, it is the line where late leveraged longs start to flinch and longer-term buyers begin to pay attention. If that area keeps doing its job and daily closes stay above $90,000, the market has enough room to drag price back toward the 61.8% Fibonacci retracement at $94,253, where many breakout traders anchored their last set of expectations. A move back into that band would be less about “new bullish trend” and more about testing how many of those traders are still willing to hold their nerve.
The daily Relative Strength Index sits at 30, parked right on the edge of oversold territory. That is usually the zone where momentum sellers have already done most of their work and faster money starts to look for bounces. But an oversold reading is a description, not a guarantee. In strong downtrends, RSI can grind along the bottom while price keeps leaking lower.
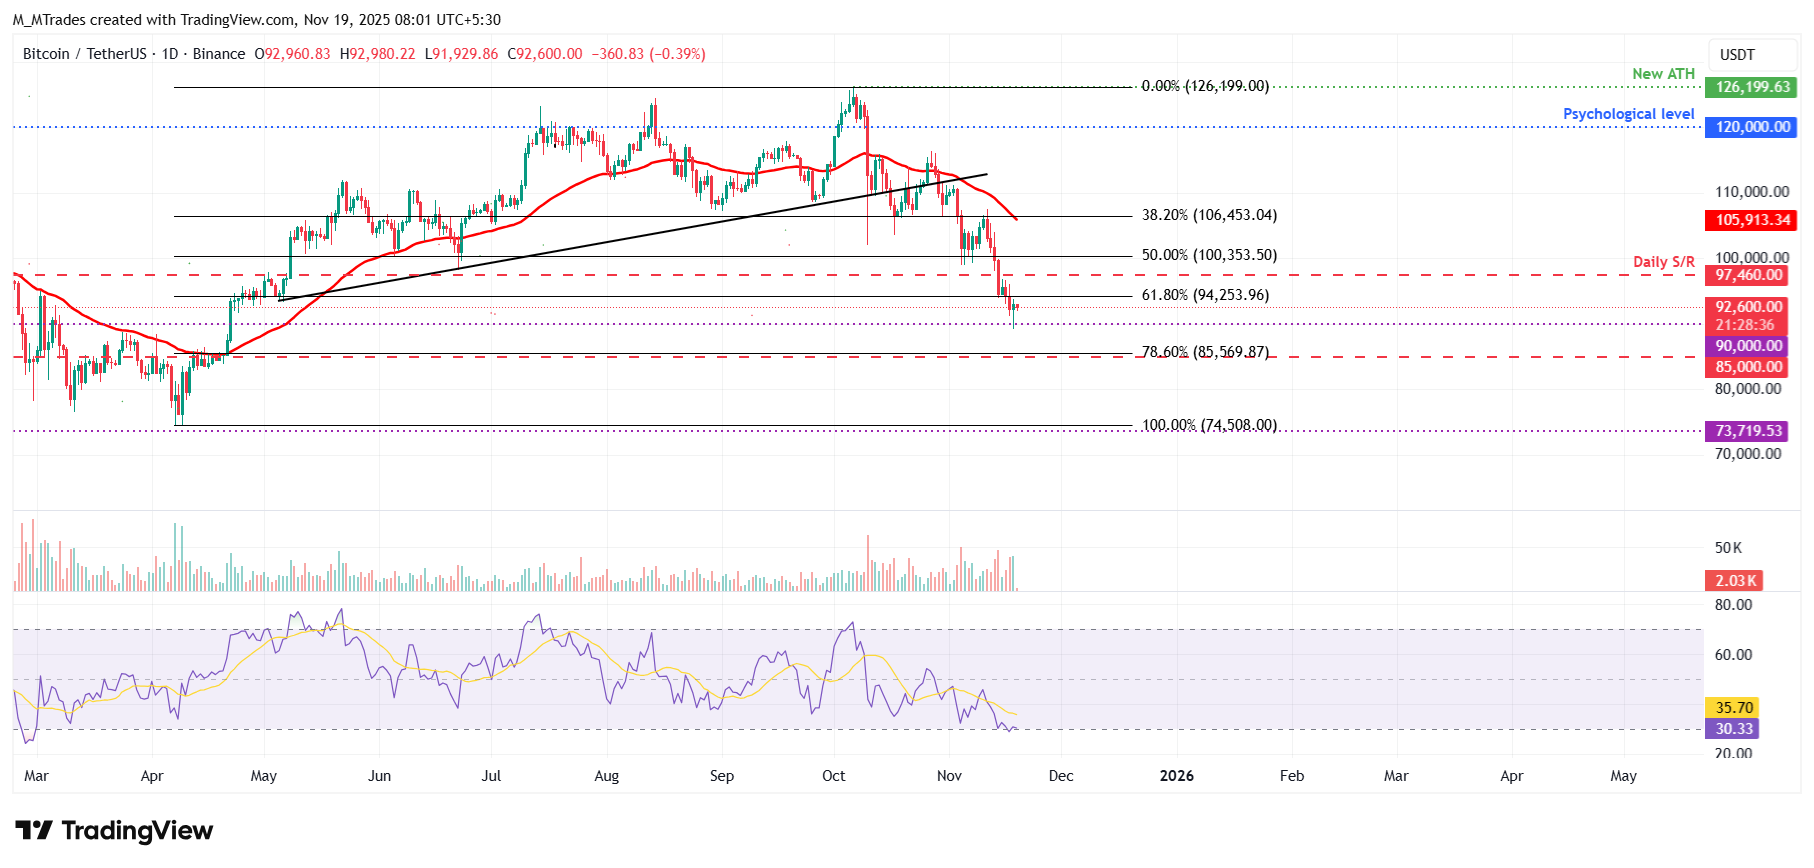
If BTC eventually starts printing daily closes below $90,000, the market sends a different message: the psychological floor has given way and the next obvious destination on the chart is the support area around $85,000. That would put more pressure on traders who treated $90,000 as a “must hold” line and force them to decide whether they are still in this move for the long haul or not.
Ethereum rebounds slightly after retesting the key support level
Ethereum’s path this week has been more abrupt, which is exactly how ETH tends to behave in both directions. Last week, price ran into a previously broken trendline near $3,592 and was pushed back hard, dropping nearly 14%. The selling spilled over into the start of this week, with ETH tagging a low of $2,946 on Tuesday before snapping back after another test of the $3,017 area. By Wednesday, ETH is trading around $3,118.
That $3,017 level is where two very different groups meet: breakout traders who were leaning on the $3,592 zone as a launchpad and have now been wrong-footed, and more patient swing traders who are happy to buy into a pullback if they feel the broader structure is intact. If ETH can keep finding support around $3,017 and build a base above it, the market has a reasonable path to re-engage the $3,592 resistance area and ask the question again: are sellers still waiting up there?
The RSI has started to lift from oversold territory, echoing what we see on Bitcoin and hinting that the most aggressive phase of the sell-off might be behind us. It doesn’t say “uptrend” yet, but it does say “panic is cooling down.” In that environment, short-term traders often shift from dumping into weakness to hunting for bounces back into well-defined resistance zones.
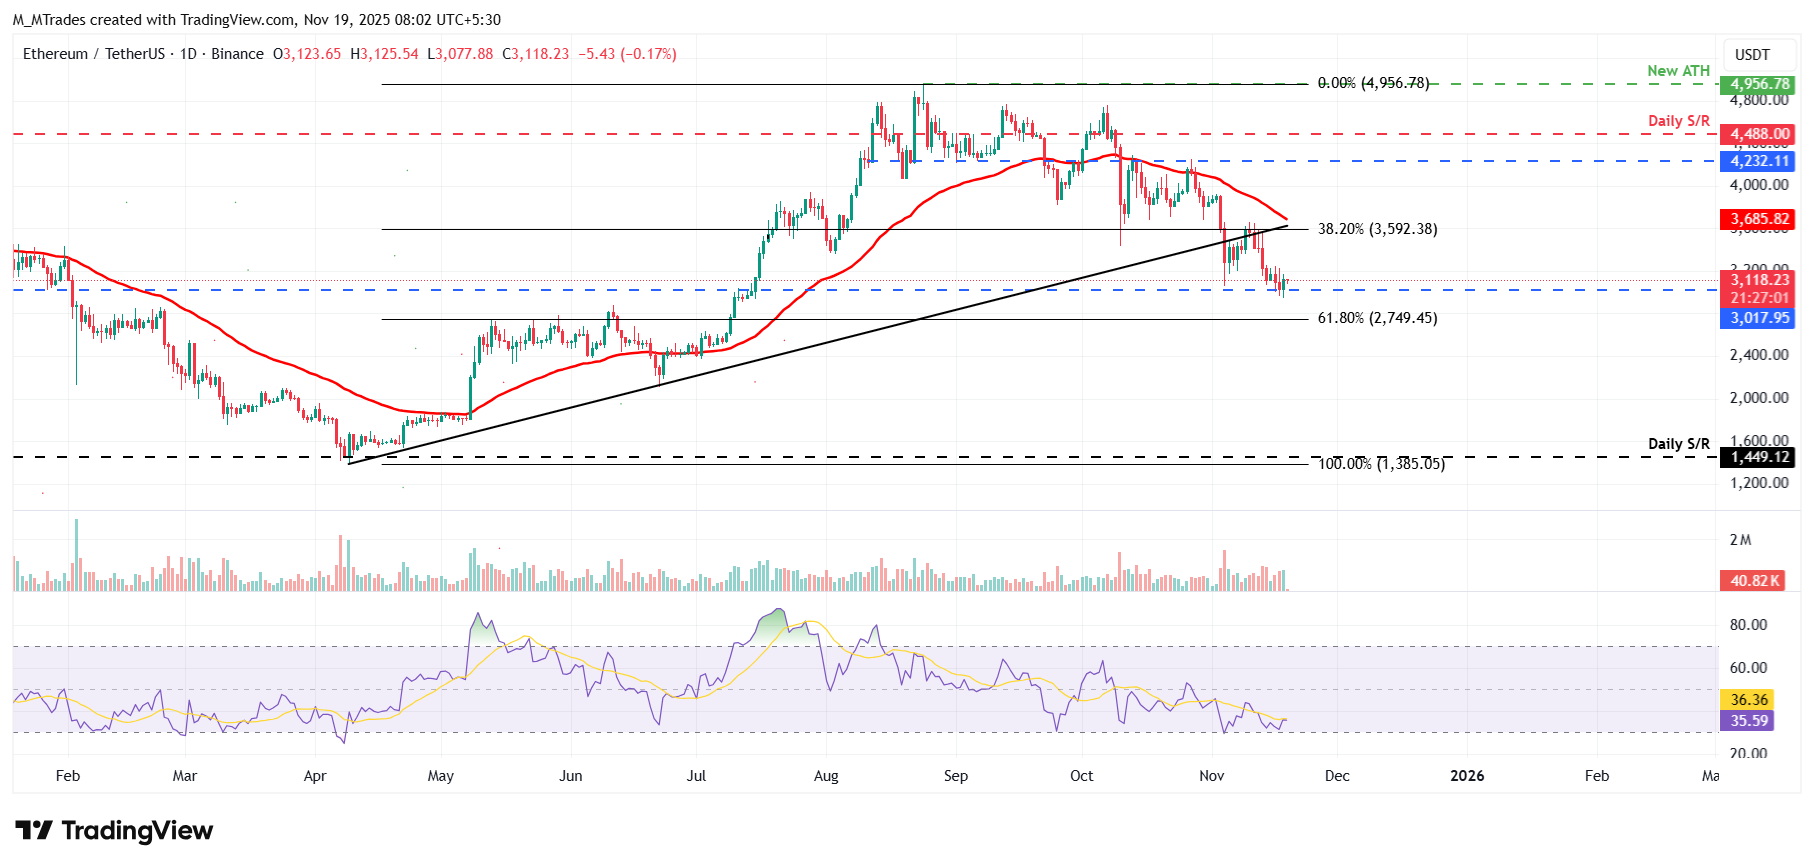
If ETH cannot hold $3,017 on a closing basis, the tone changes quickly. The next key level sits around $2,749. A move toward that support would mean that last week’s rejection at $3,592 was not just a sharp shakeout but the start of a deeper reset, and it would force longer-term bulls to decide how much drawdown they are willing to tolerate before stepping aside.
XRP’s momentum indicators hint at fading bearish strength
XRP has been playing a slightly different game. Instead of breaking from a clear trendline like ETH, it ran straight into its 50-day exponential moving average at $2.47 last week and was pushed back nearly 7%. The drop continued into Monday, followed by a modest rebound on Tuesday. On Wednesday, XRP is hovering near $2.21, just below the $2.23 area where it has been trying to catch its breath.
For many short-term traders, that 50-day EMA at $2.47 is the dividing line between “just a bounce” and “maybe something more.” If XRP can keep grinding higher from current levels and re-test $2.47, any breakout above that moving average would not just be a neat technical event; it would tell us that sellers who controlled last week’s move are losing their grip and that dip-buyers are willing to hold beyond a single session.
The daily RSI around 41 fits with that picture of a market that is no longer in full-blown risk-off mode but has not yet flipped to outright optimism. Bears are not pressing as hard as they were, yet bulls have not done enough to drag the indicator back above the neutral 50 line. That middle zone often translates into choppy price action, where both sides get tested.
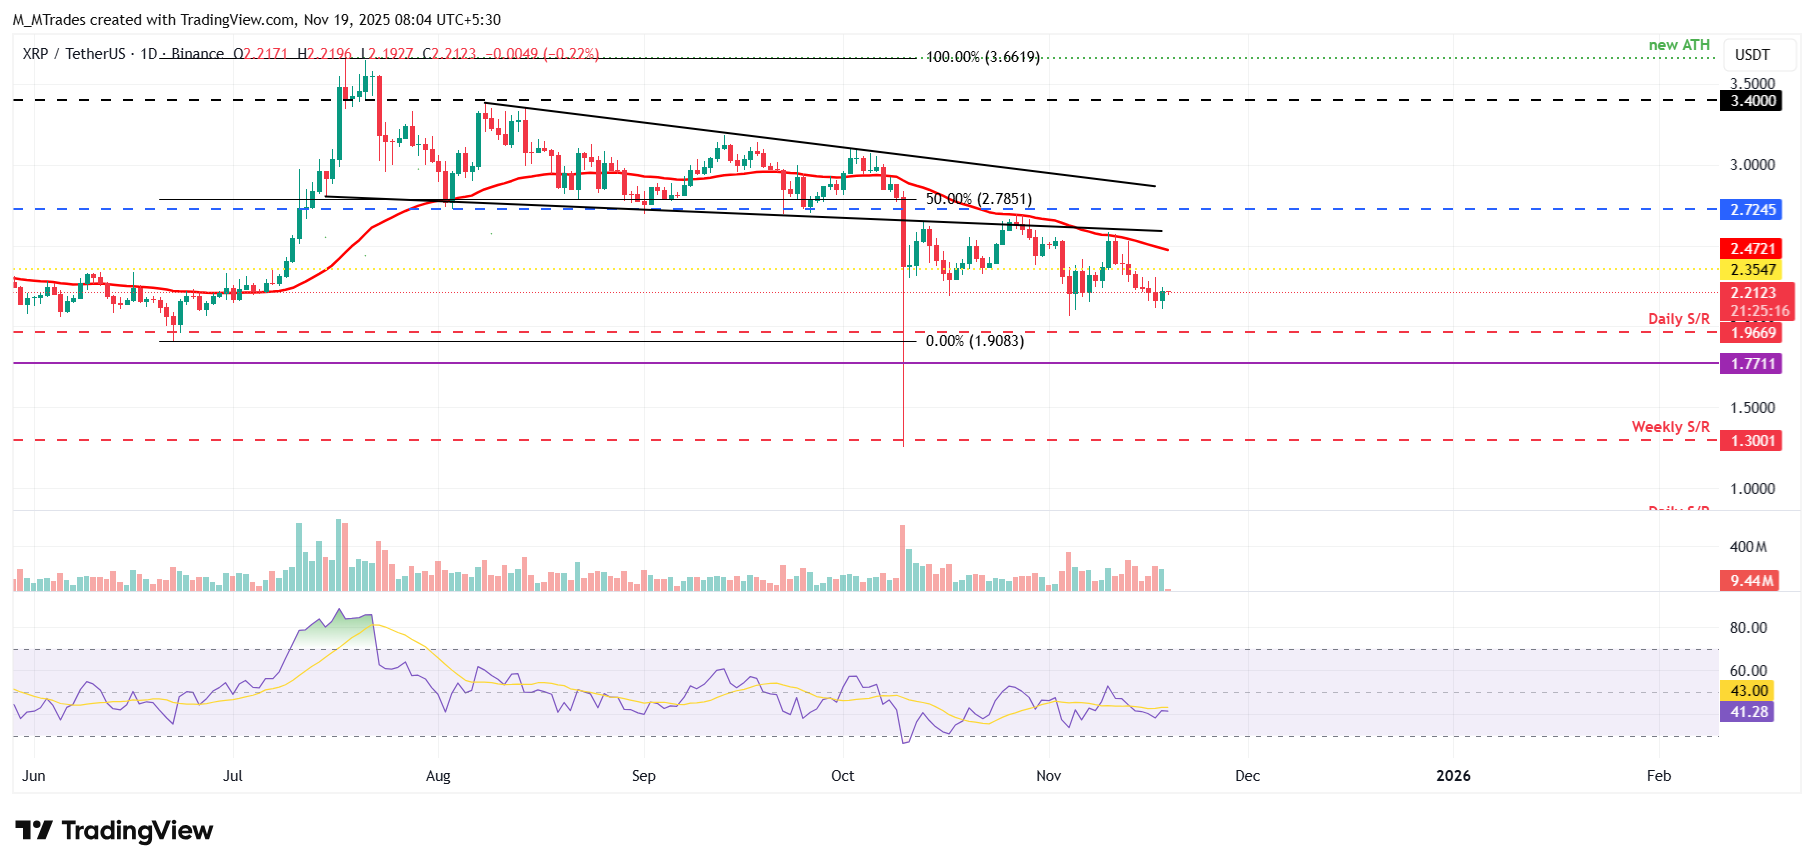
If XRP cannot build on the current bounce and the correction resumes, the next level on the radar is the daily support around $1.96. A slide toward that area would reinforce the idea that recent strength off the lows was just a pause inside a broader downtrend, rather than the opening leg of a new recovery.
Read more
The above content was completed with the assistance of AI and has been reviewed by an editor.


