

Top 3 Price Prediction: Bitcoin, Ethereum, Ripple – BTC, ETH, and XRP flash deeper downside risks as market selloff intensifies

- International Oil Prices Retreat Rapidly; G-7 to Discuss Emergency Oil Reserve Release
- Senate to vote on Trump’s pro-Bitcoin Fed pick as BTC hits four-week high
- Gold slumps below $5,100 as US Dollar gains
- Crypto’s Great Recovery: Is the Post-Conflict Surge a Sustainable Rally or a Sophisticated Bull Trap?
- WTI recovers to near $86.50 as Strait of Hormuz remains closed
- Gold slumps to near $5,050 on oil-driven inflation fears, stronger US Dollar

Bitcoin trades below $100,000 on Friday, extending its decline after correcting more than 5% so far this week.
Ethereum dropped over 10% this week, slipping further after facing rejection at its previously broken trendline.
XRP closes below its daily support at $2.35, signaling the possibility of a deeper correction ahead.
Bitcoin (BTC), Ethereum (ETH) and Ripple (XRP) trade in red on Friday after correcting more than 5%, 10% and 2%, respectively, so far this week. BTC has slipped below the $100,000 key level, while ETH and XRP have faced rejection at their resistance levels, signaling that bears remain firmly in control and that a deeper correction may be underway.
Bitcoin slips below $100,000 as bears tighten grip, signaling deeper correction
Bitcoin price faced rejection at the 38.20% Fibonacci retracement level at $106,453 (drawn from the April 7 low of $74,508 to the all-time high of $126,299 set on October 6) on Monday and declined nearly 6% by Thursday. At the time of writing on Friday, BTC is trading down around $99,300.
If BTC continues its correction and closes below the daily support at $97,460, it could extend the decline toward the key psychological level at $95,000.
The Relative Strength Index (RSI) is 35, below its neutral level of 50, indicating strong bearish momentum. The Moving Average Convergence Divergence also showed a bearish crossover, signaling a sell and further supporting the bearish view.
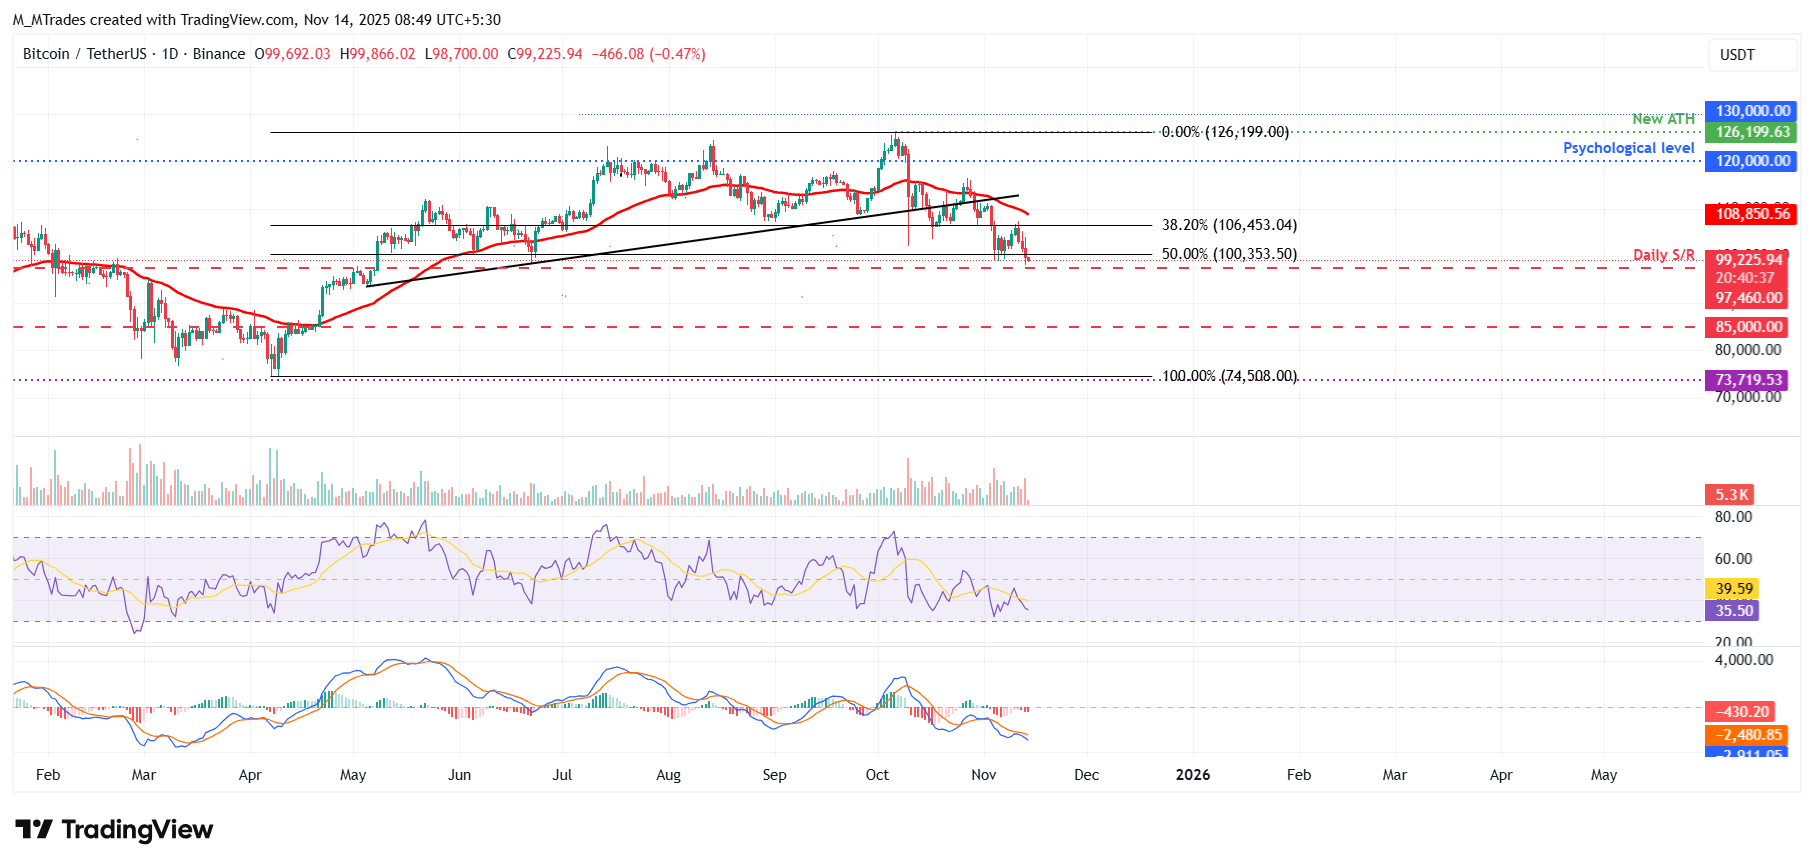
On the other hand, if BTC recovers, it could extend the recovery toward the 38.20% Fibonacci retracement at $106,453.
Ethereum corrects after facing rejection from the key resistance level
Ethereum price faced rejection at the previous broken trendline around $3,592 on Monday and declined by nearly 10% over the next three days. At the time of writing on Friday, ETH hovers at around $3,200.
If ETH continues its pullback and closes below the $3,170 support level, it could extend the decline toward the daily support at $3,017.
Like Bitcoin, Ethereum’s RSI and MACD indicate bearish momentum gaining traction, signaling a deeper correction ahead.
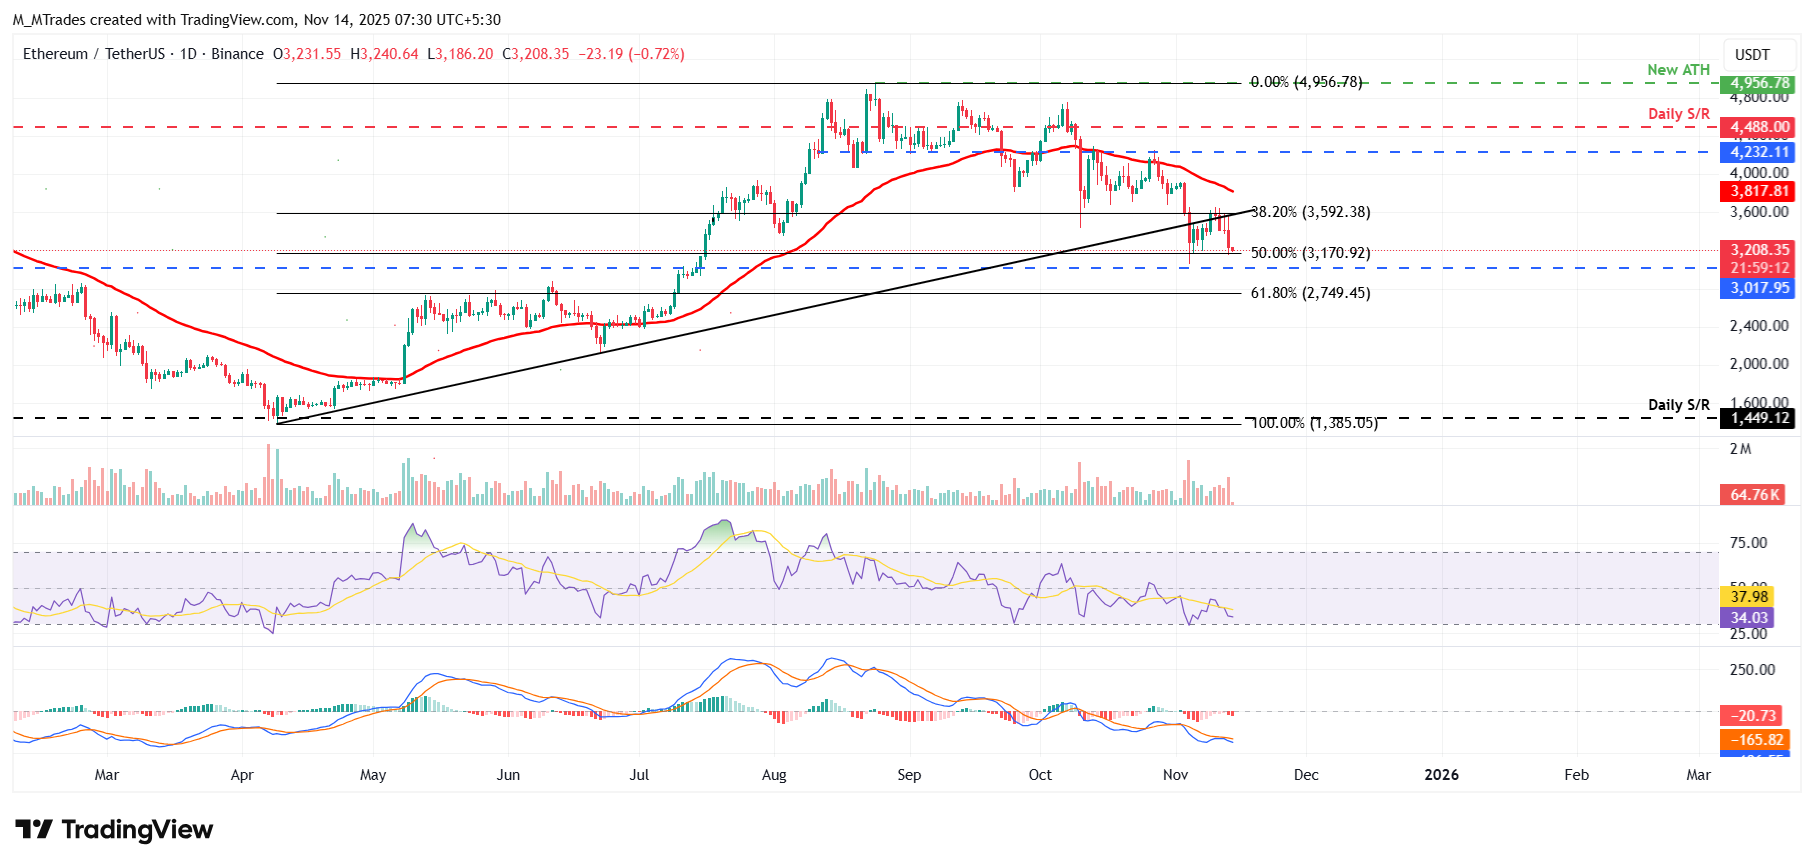
However, if ETH recovers, it could extend the recovery toward the 38.20% Fibonacci retracement level at $3,592.
XRP could correct further as it closes below daily support at $2.35
XRP price surged 6.75% on Monday, retesting the 50-day EMA at $2.53. However, it surrendered most of those gains on Tuesday after failing to break through that same resistance level. XRP again faced rejection from the 50-day EMA at $2.53 on Thursday and declined 2.74%, closing below the daily support at $2.35. At the time of writing on Friday, XRP trades down at around $2.30.
If XRP continues its correction, it could extend the decline toward the next daily support at $1.96.
Like Bitcoin and Ethereum, XRP’s RSI signals bearish momentum, while the MACD indicates indecision among traders.
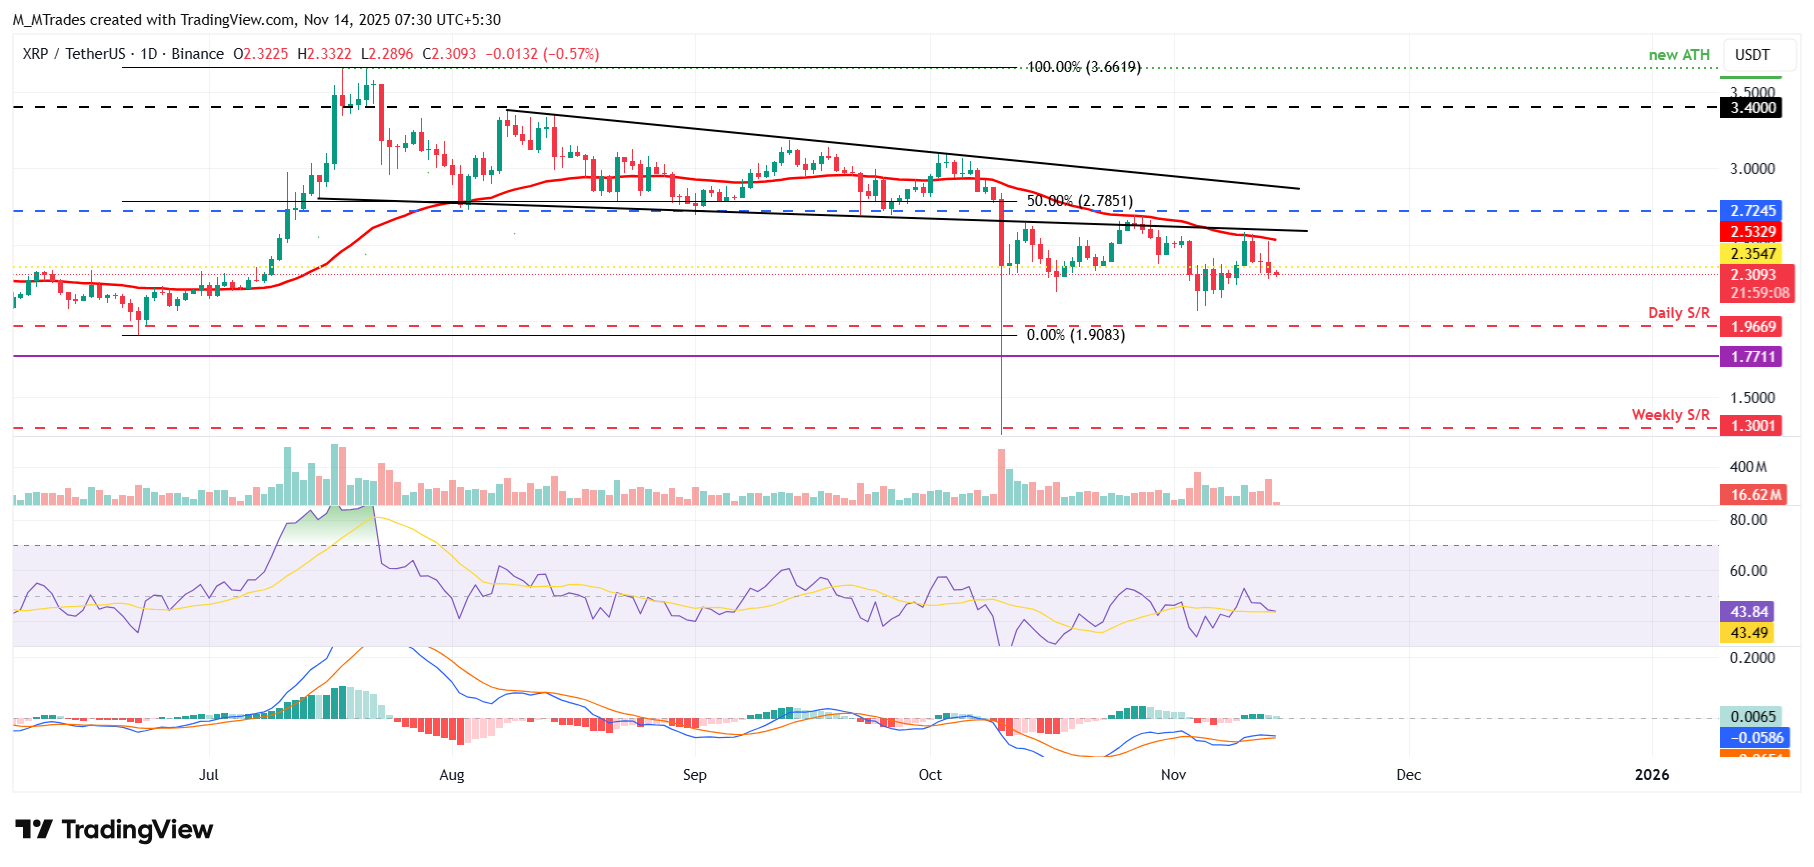
On the other hand, if XRP recovers, it could extend the recovery toward the 50-day EMA at $2.53.
Read more
* The content presented above, whether from a third party or not, is considered as general advice only. This article should not be construed as containing investment advice, investment recommendations, an offer of or solicitation for any transactions in financial instruments.


