


Top 3 Price Prediction: BTC breakdown hints at deeper correction as ETH and XRP extend losses


Bitcoin price is breaking below the lower consolidation range on Monday, a firm close suggests a deeper correction.
Ethereum slips below $1,900, extending its six-week losing streak.
XRP slides below $1.40, failing to find support at the lower trendline boundary.
Bitcoin (BTC), Ethereum (ETH) and Ripple (XRP) prices are extending losses on Monday after falling slightly the previous week. BTC is slipping below the lower consolidation range at $65,000, and ETH is falling below $1,900, both extending their six-week losing streaks. Meanwhile, XRP slides below $1.40 and unable to find support at the lower trendline; all top three cryptocurrencies are hinting at a deeper correction.
Bitcoin is breaking below the lower consolidation boundary
Bitcoin price has been consolidating within a range between $65,729 and $71,746 since February 7. As of Monday, BTC is slipping below the lower consolidation range and trading at $64,700.
If BTC closes below the lower consolidation level at $65,729 on a daily basis, it could extend the decline toward the key support level at $60,000.
The Relative Strength Index (RSI) on the daily chart reads 31, nearing the oversold conditions, indicating strong bearish momentum. The Moving Average Convergence Divergence (MACD) lines are converging, indicating indecisiveness among traders.
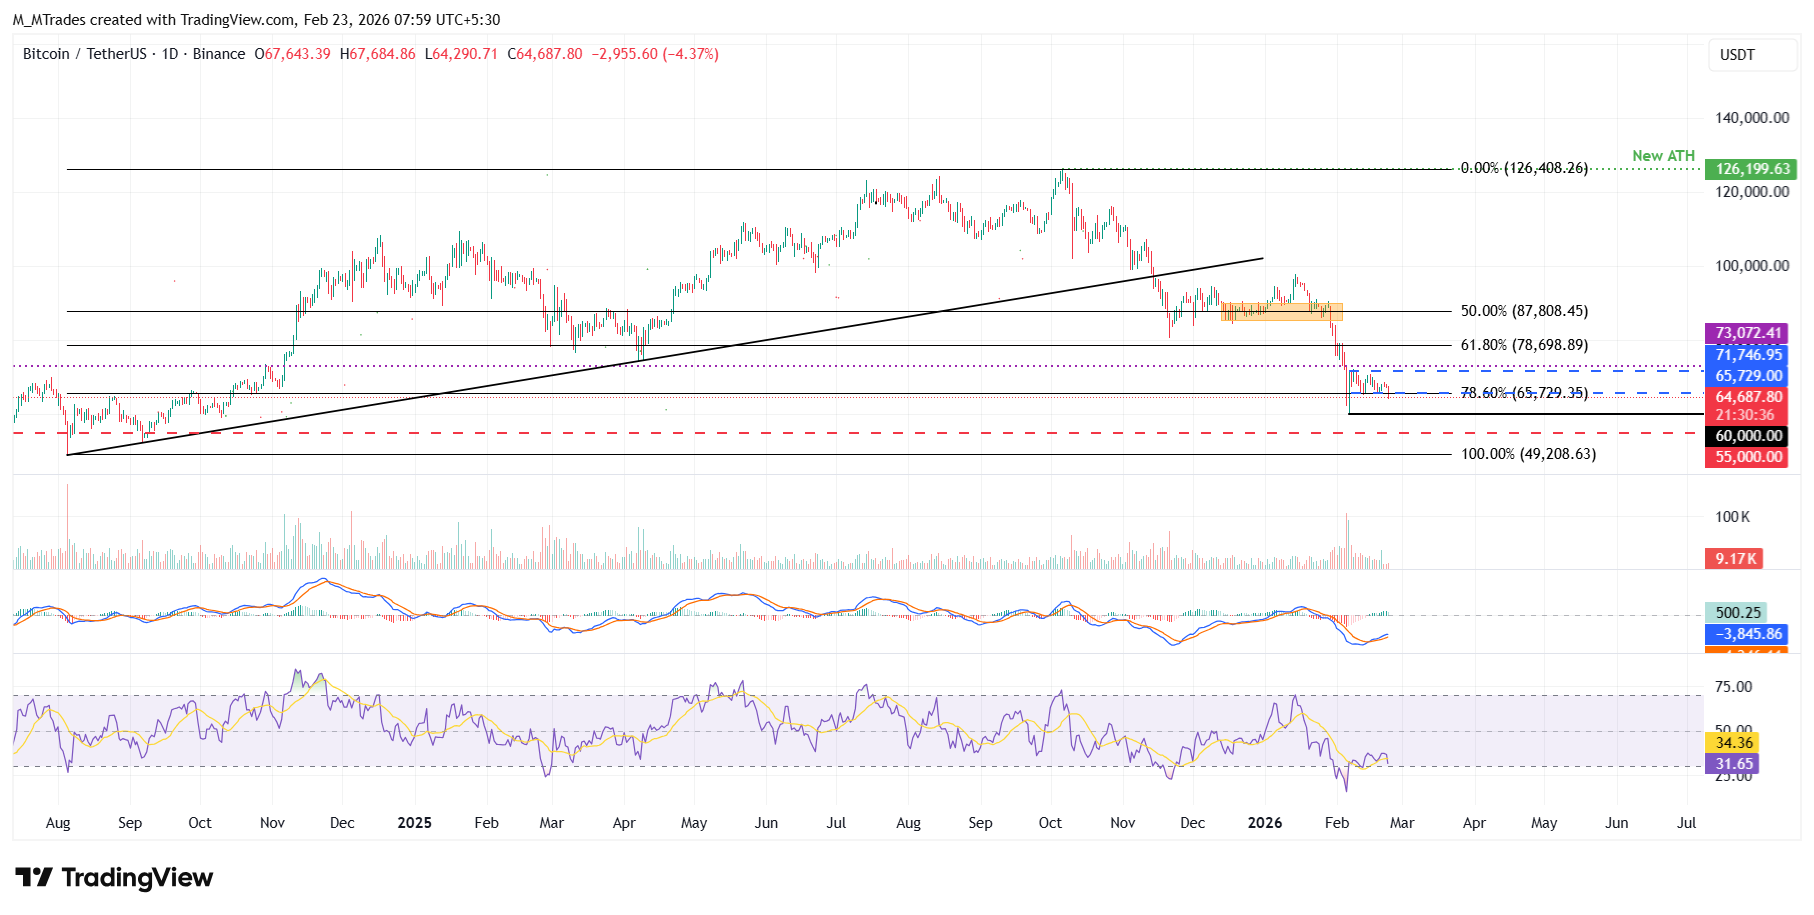
On the other hand, if BTC continues to find support around the lower consolidation range at $65,729, it could extend the advance toward the upper consolidation range at $71,746.
Ethereum extends correction
Ethereum price corrected slightly during the previous week, extending the loss since mid-January. As of Monday, ETH is trading down by 4.77% at $1,864.
If ETH closes below the lower consolidation range at $1,747 on a daily basis, it could extend the decline toward the daily support at $1,669.
Like Bitcoin, Ethereum’s RSI shows bearish momentum gaining traction, while the MACD lines are converging, indicating indecision among traders.
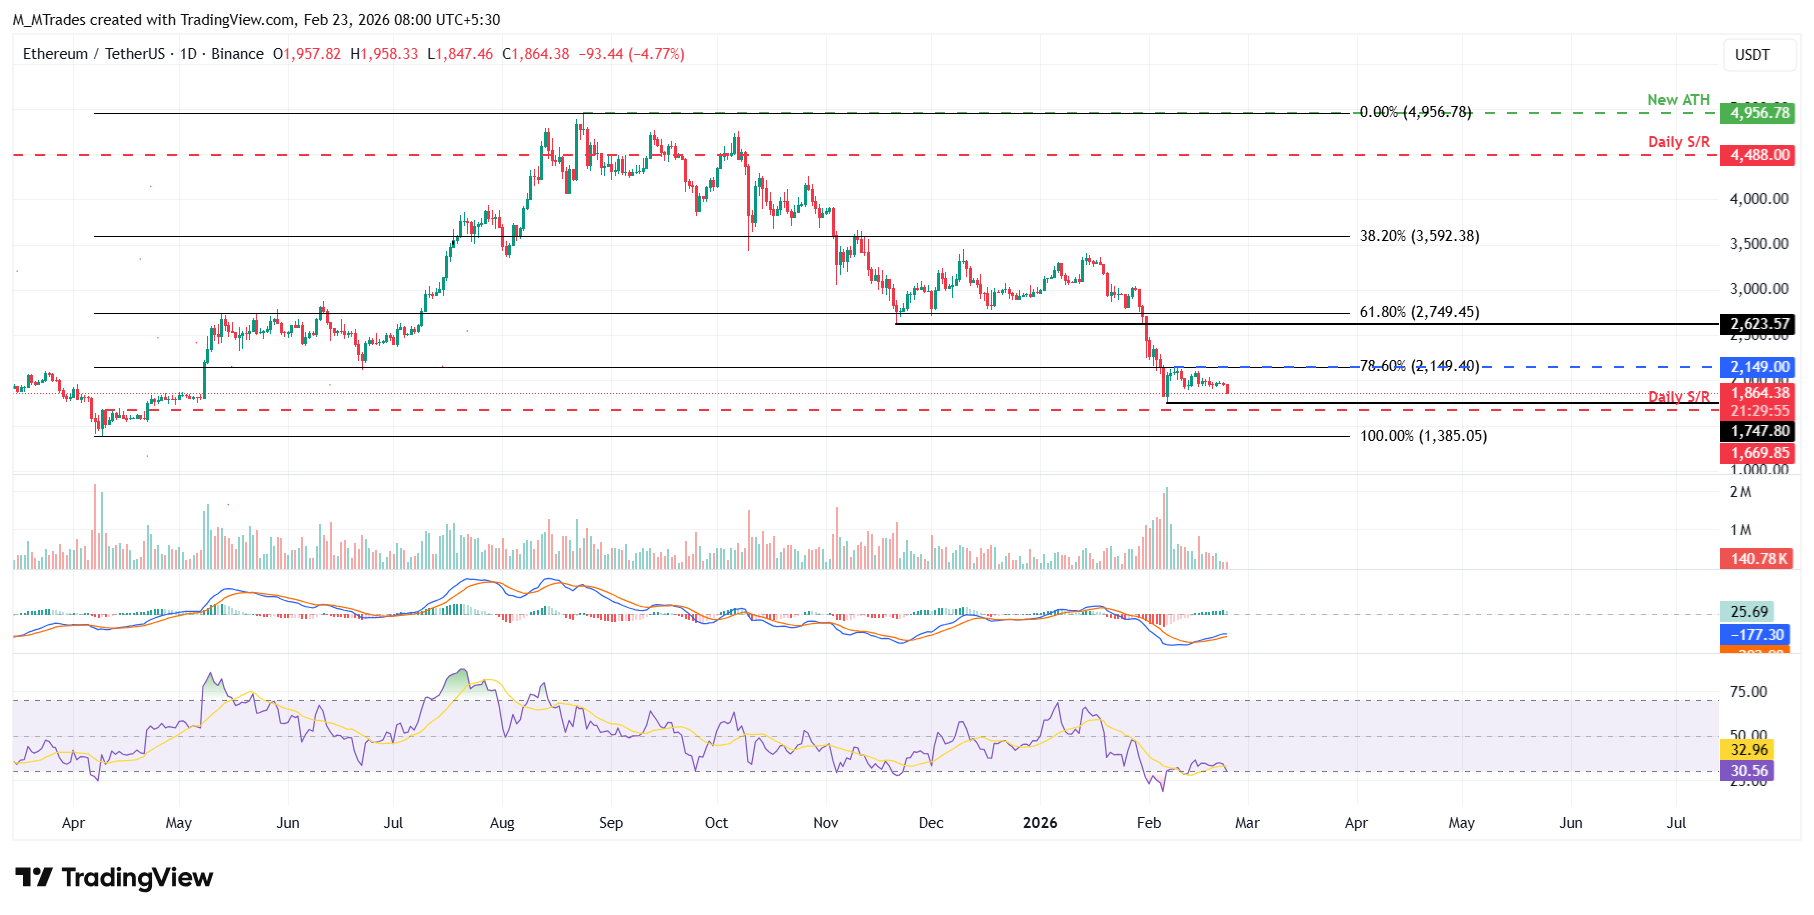
However, if ETH recovers, it could extend the advance toward the upper consolidation range at $2,149.
XRP extends correction as the lower trendline boundary fails to hold
XRP price is trading below $1.40 on Monday, failing to find support at the lower trendline boundary of a falling wedge.
If XRP continues its correction, it could extend the decline toward the weekly support at $1.30.
Like Bitcoin and Ethereum, XRP’s RSI shows bearish momentum gaining traction, while the MACD lines are converging, indicating indecision among traders.
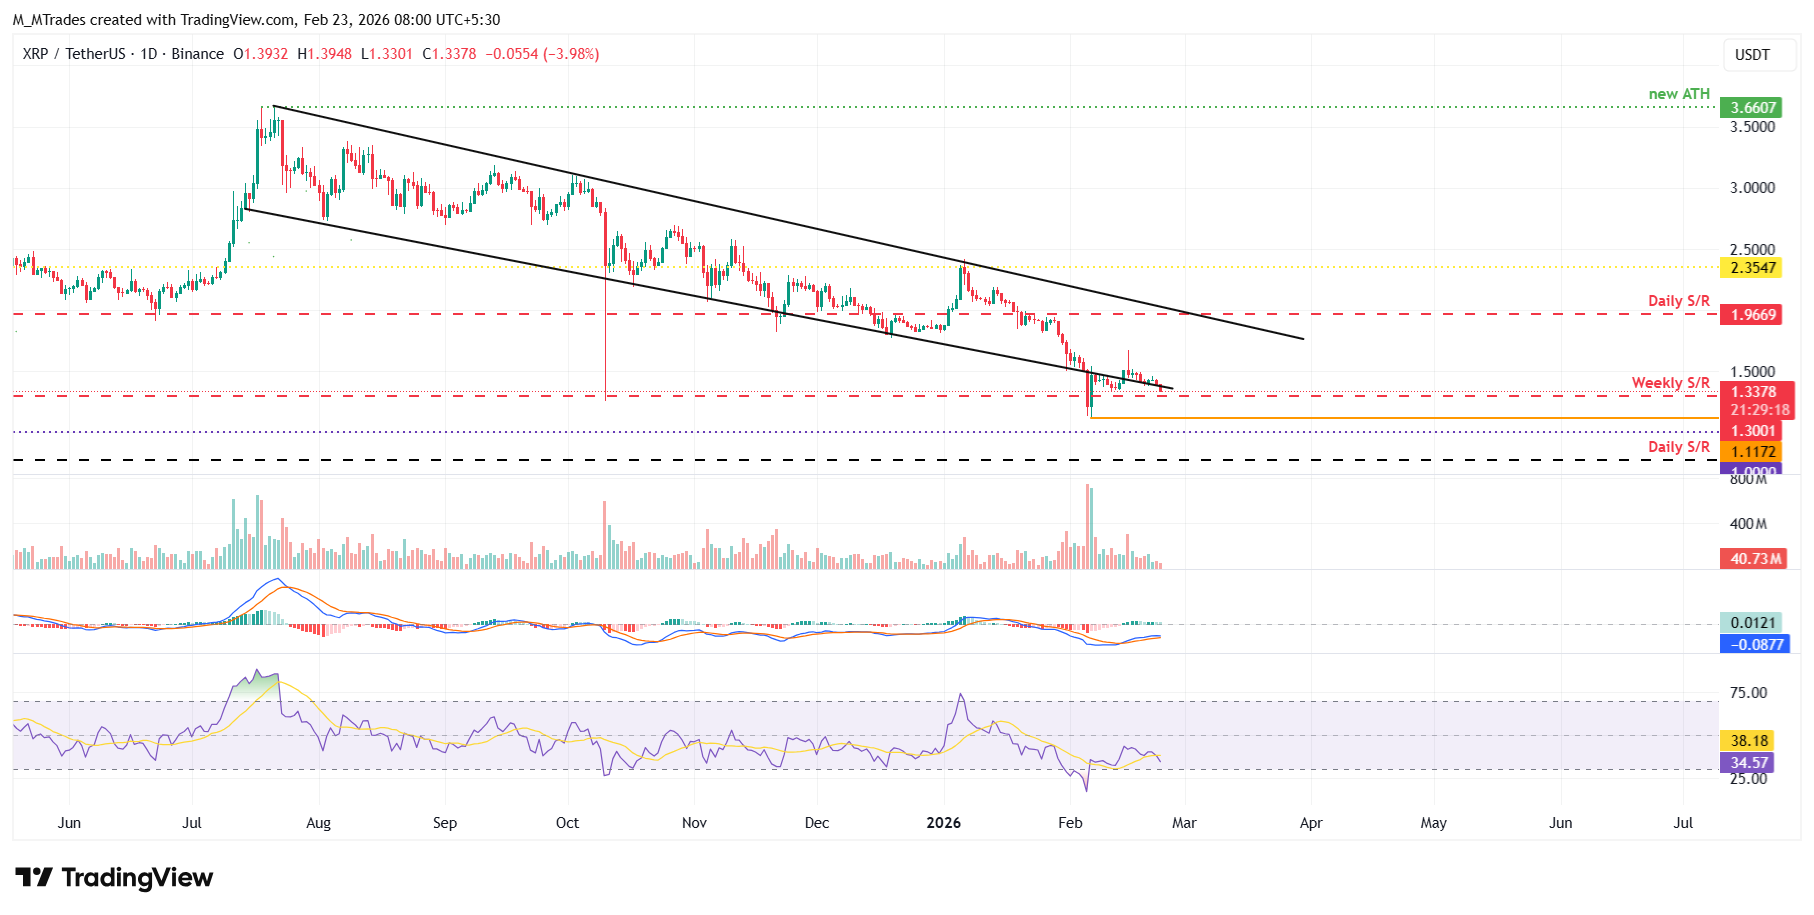
Conversely, if the lower trendline boundary holds as support, it could extend the recovery toward the key psychological level at $1.50.
Read more
* The content presented above, whether from a third party or not, is considered as general advice only. This article should not be construed as containing investment advice, investment recommendations, an offer of or solicitation for any transactions in financial instruments.


