

Silver Price Forecast: XAG/USD depreciates to near $28.50 due to bearish bias

- Gold Price Forecast: Gold Poised to Break $4,200 as Oil Price Slump Eases Inflation Fears
- Gold Price Forecast: Oil Price Breaking $100 Fuels Inflation Concerns, Will Gold Prices Fall Further?
- Middle East War updates: US-Iran pause strikes as Trump weighs up diplomatic options
- WTI climbs above $87.00 as Middle East conflict threatens key choke points
- Today’s Market Recap: Oil Breaks $100, Fueling Inflation Fears, as AI Capex Faces Scrutiny and Tesla’s 14% Plunge Drags Down Tech Sector
- WTI Crude Breaks $90, Brent Crude Approaches $100, Middle East Shipping Risks Drive Continuous Rise in Oil Prices

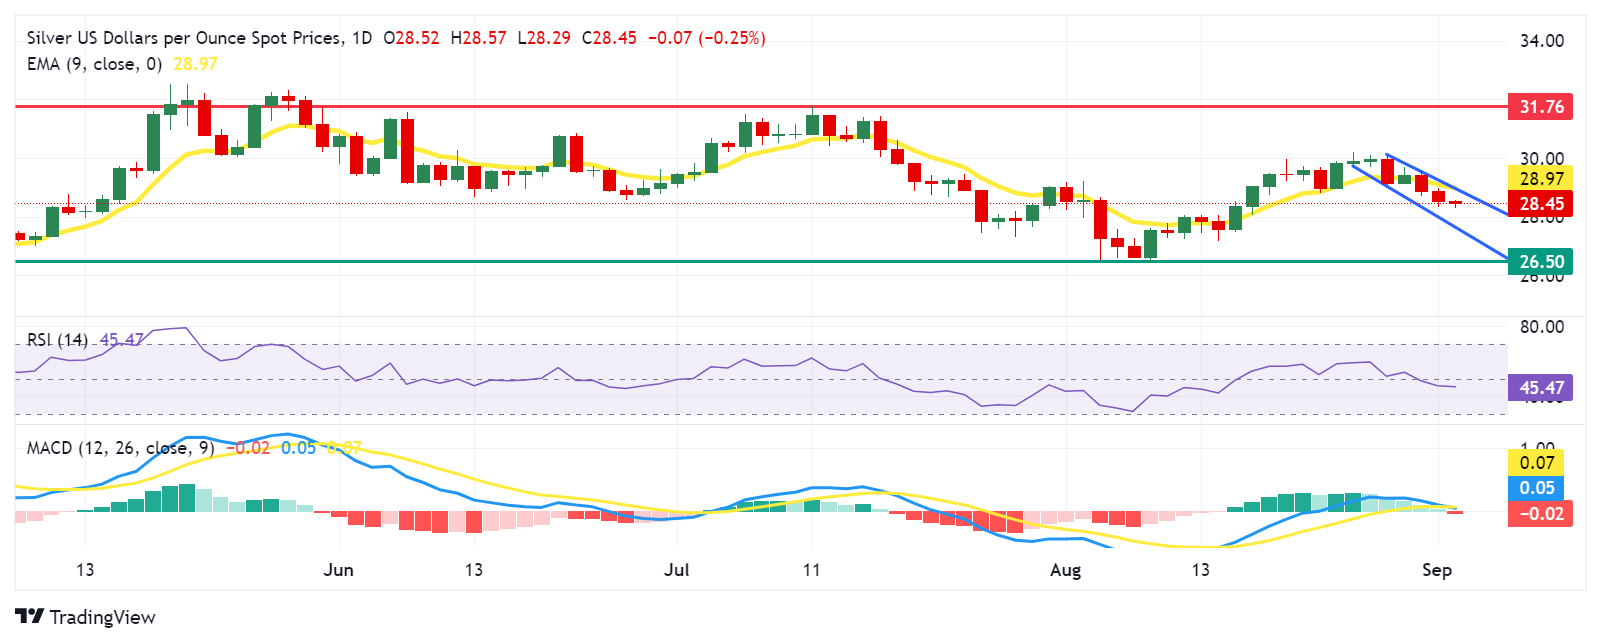
Silver price faces challenges as daily chart analysis suggests a bearish bias.
The MACD line has crossed below the signal line, indicating potential downward pressure on the Silver price.
Silver price may navigate the area around the lower boundary of the descending channel at the level of $27.70 level.
Silver price (XAG/USD) extends its losses for the third consecutive day, trading around $28.50 per troy ounce during Tuesday’s Asian hours. The analysis of the daily chart shows that the pair is positioned within a descending channel, suggesting a bearish bias. Additionally, the 14-day Relative Strength Index (RSI) is positioned below the 50 level, confirming a bearish trend.
The momentum indicator Moving Average Convergence Divergence (MACD) line has crossed below the signal line, it is generally considered a bearish signal. This crossover suggests that the momentum is shifting from bullish to bearish, indicating potential downward pressure on the Silver's price.
In terms of support, the Silver price may navigate the region around the lower boundary of the descending channel at the level of $27.70 level. A break below this level could strengthen the bearish bias and drive the asset’s price toward throwback support $26.50 level.
On the upside, the Silver price tests an immediate resistance at the upper boundary of the descending channel around the nine-day Exponential Moving Average (EMA) at the $28.97 level. A breakthrough above the latter could lead the XAG/USD pair to explore the region around the three-month high at the $31.76 level.
XAG/USD: Daily Chart
Read more
* The content presented above, whether from a third party or not, is considered as general advice only. This article should not be construed as containing investment advice, investment recommendations, an offer of or solicitation for any transactions in financial instruments.


