

Silver Price Analysis: XAG/USD hits eight-day low, technicals suggest further declines

- Gold Price Forecast: Gold Poised to Break $4,200 as Oil Price Slump Eases Inflation Fears
- Gold Price Forecast: Oil Price Breaking $100 Fuels Inflation Concerns, Will Gold Prices Fall Further?
- Middle East War updates: US-Iran pause strikes as Trump weighs up diplomatic options
- WTI climbs above $87.00 as Middle East conflict threatens key choke points
- Today’s Market Recap: Oil Breaks $100, Fueling Inflation Fears, as AI Capex Faces Scrutiny and Tesla’s 14% Plunge Drags Down Tech Sector
- WTI Crude Breaks $90, Brent Crude Approaches $100, Middle East Shipping Risks Drive Continuous Rise in Oil Prices

Silver price drops to $22.43, approaching key technical support that may indicate a nearing bottom.
Technical analysis points to a potential decline toward yearly lows if prices fall decisively below $22, showcasing bearish trends.
A rebound above $23.00 might steer silver towards challenging the $23.30 resistance level, giving bulls an opportunity for recovery.
Silver price falls to an eight-day low of $22.43, though it appears to have bottomed out at around the $22.40-50 area. The advance of US Treasury bond yields capped the nonyielding metal, with XAG/USD trading at $22.49, down 0.04%.
XAG/USD Price Analysis: Technical outlook
The daily chart portrays that XAG/USD has extended its losses to levels last seen at around mid-February after briefly testing the confluence of the 50, 100, and 200-day moving averages (DMAs) at around the $23.00-$23.30 area.
Even though Silver’s price action remains sideways, it’s tilted to the downside, but sellers must step in and drag prices below the $22.00 figure. Once achieved, that would open the door to test the yearly lows of $21.93, the November 13 low of $21.88, and the October 3 low of $20.69.
On the other hand, if XAG/USD buyers lift the spot price above $23.00, look for a re-test of the $23.30 area.
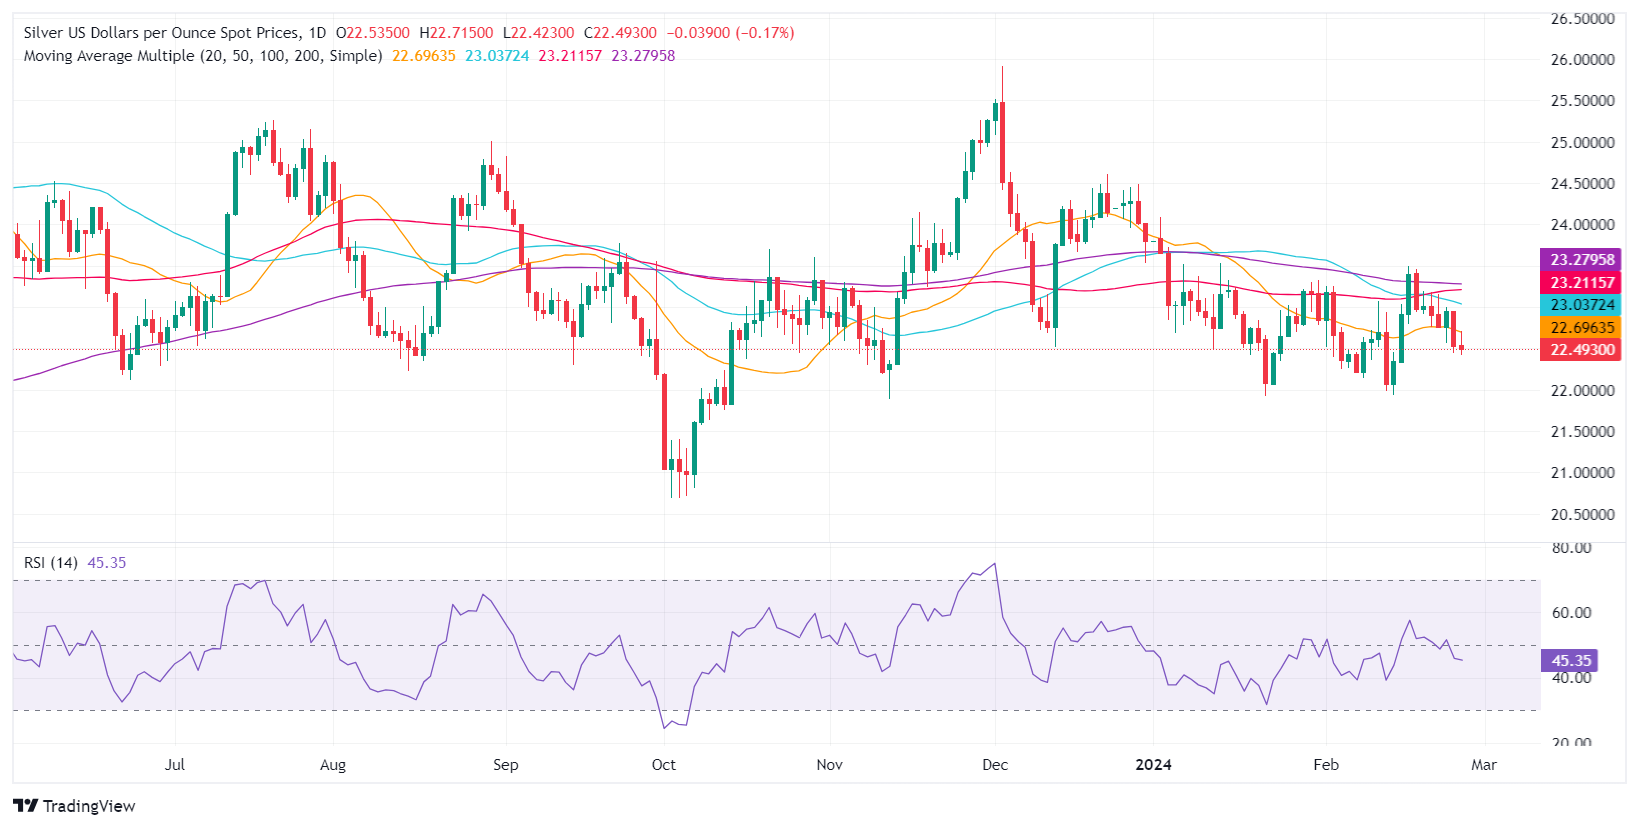
XAG/USD Price Action – Daily Chart
Read more
* The content presented above, whether from a third party or not, is considered as general advice only. This article should not be construed as containing investment advice, investment recommendations, an offer of or solicitation for any transactions in financial instruments.


