

Gold drops as Hormuz firefight fuels US Dollar jump
- US-Iran strikes near Hormuz lift Oil and US Dollar demand.
- ADP, JOLTS and ISM data show resilient US conditions.
- Williams says Fed policy is right ahead of Beige Book release.
Gold (XAU/USD) price slumps over 1% on Wednesday, losing for the second day in the week amid fears that hostilities between the US and Iran may escalate, pushing energy prices higher and the US Dollar as well.
Geopolitics weigh on Gold, as Oil shock revives inflation fears
Tensions in the Middle East are high after Iran and the US exchanged fire near the Strait of Hormuz. The US CENTCOM carried out “defensive strikes” against Iran’s missile launchers and boats poised to lay mines. On the other hand, Tehran attacked US bases in Gulf States like Kuwait, the United Arab Emirates (UAE) and Saudi Arabia.
Oil prices rose as a possible resumption of negotiations seems far after Iran’s Fars news agency reported that talks had stalled, even though US President Donald Trump denied it.
This raised concerns about Oil supply disruptions, which are threatening to trigger a second wave of inflation and force major central banks to raise interest rates.
West Texas Intermediate (WTI), the US crude Oil benchmark, posted gains of more than 2.50%, a tailwind for the Greenback. The US Dollar Index (DXY), which tracks the performance of the buck’s value against six currencies, is up 0.32% at 99.53
US data to prevent the Fed from cutting
US jobs data indicates a strong labor market, with May's ADP National Employment increasing by 122K, surpassing the forecast of 117K. This, along with Tuesday’s JOLTS report showing a rise in job openings, paints a resilient picture of US employment ahead of the release of Nonfarm Payroll figures, which are expected to increase by 85K.
Recently, the ISM Services PMI rose from 53.6 to 54.5 in May as businesses ordered in anticipation of higher prices. The Prices Paid component increased from 70.7 to 71.3, showing the energy shock is spreading to the services sector.
In the meantime, the New York Fed President John Williams said that monetary policy “is exactly in the right place,” adding that he doesn’t “see any need to raise or lower interest rates right now.”
Ahead traders will eye Dallas Fed President Lorie Logan speech, along with the release of the Fed’s Beige Book, ahead of the June 16-17 meeting.
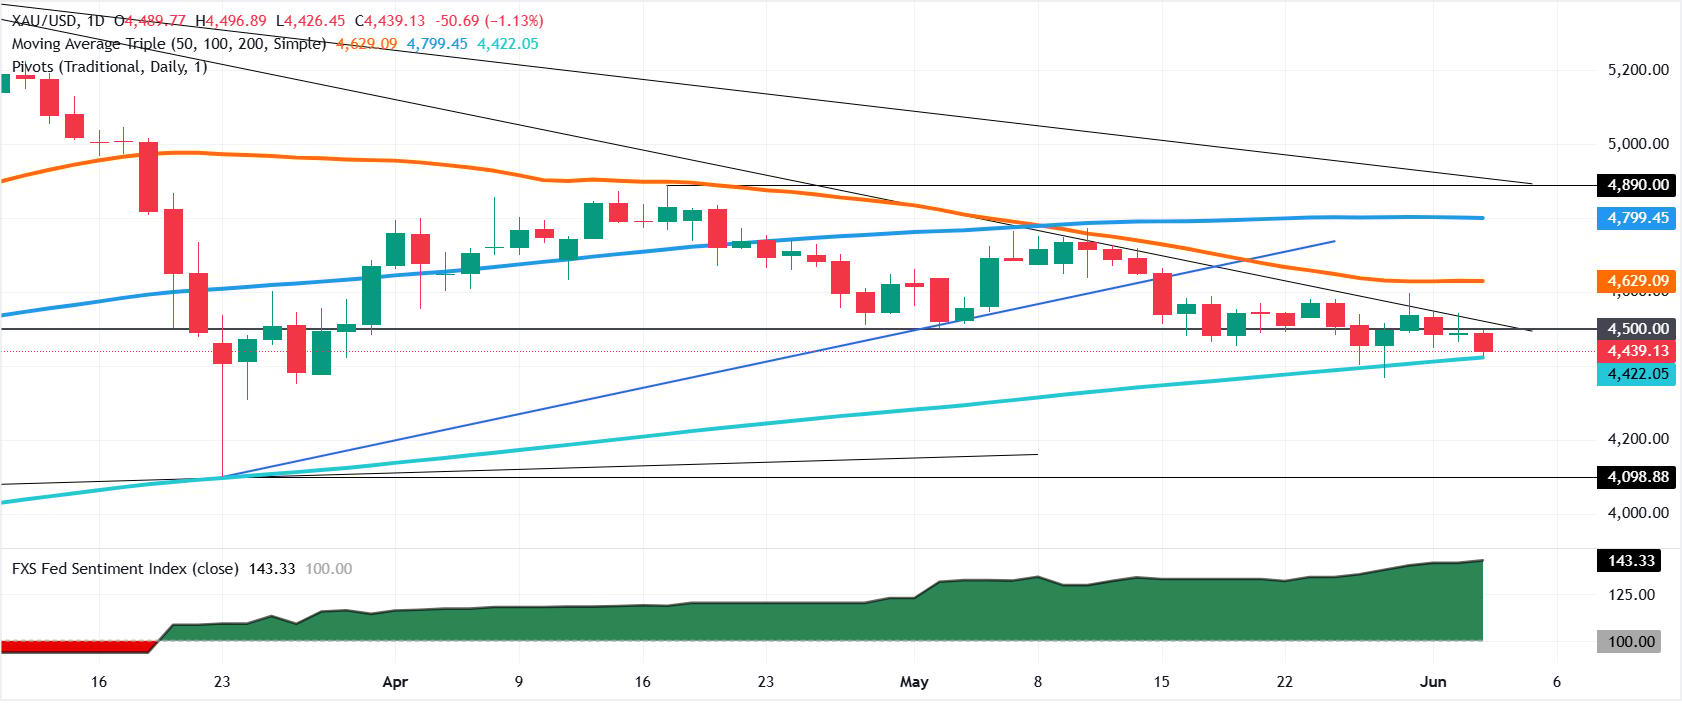
XAU/USD technical outlook: Gold’s downtrend continues below the 20-day SMA
Gold extends its downtrend, reaching four-day lows at $4,426, poised to hit $4,400 sooner than $4,500. Momentum shifted mildly bearish, with price action printing successive series of lower highs and lows, closing near the 200-day Simple Moving Average (SMA) of $4,422, which, once surpassed, would pave the way for further losses.
The Relative Strength Index (RSI) is bearish, pointing downwards, confirming that sellers are stepping in to drive Gold’s prices lower.
If XAU/USD clears the 200-day SMA, look for a test of $4,400. Below this area lies the current yearly low of $4,098, the March 23 daily low.
Upwards, Gold must reclaim $4,500 before testing the 20-day SMA at $4,573. Above this area is the 50-day SMA at $4,626, followed by the 100-day SMA at $4,794.
Gold FAQs
Gold has played a key role in human’s history as it has been widely used as a store of value and medium of exchange. Currently, apart from its shine and usage for jewelry, the precious metal is widely seen as a safe-haven asset, meaning that it is considered a good investment during turbulent times. Gold is also widely seen as a hedge against inflation and against depreciating currencies as it doesn’t rely on any specific issuer or government.
Central banks are the biggest Gold holders. In their aim to support their currencies in turbulent times, central banks tend to diversify their reserves and buy Gold to improve the perceived strength of the economy and the currency. High Gold reserves can be a source of trust for a country’s solvency. Central banks added 1,136 tonnes of Gold worth around $70 billion to their reserves in 2022, according to data from the World Gold Council. This is the highest yearly purchase since records began. Central banks from emerging economies such as China, India and Turkey are quickly increasing their Gold reserves.
Gold has an inverse correlation with the US Dollar and US Treasuries, which are both major reserve and safe-haven assets. When the Dollar depreciates, Gold tends to rise, enabling investors and central banks to diversify their assets in turbulent times. Gold is also inversely correlated with risk assets. A rally in the stock market tends to weaken Gold price, while sell-offs in riskier markets tend to favor the precious metal.
The price can move due to a wide range of factors. Geopolitical instability or fears of a deep recession can quickly make Gold price escalate due to its safe-haven status. As a yield-less asset, Gold tends to rise with lower interest rates, while higher cost of money usually weighs down on the yellow metal. Still, most moves depend on how the US Dollar (USD) behaves as the asset is priced in dollars (XAU/USD). A strong Dollar tends to keep the price of Gold controlled, whereas a weaker Dollar is likely to push Gold prices up.
Recommended Articles


