


Salesforce Stock Price Prediction: Hit by Global Service Outage During Dreamforce, Can the Stock Recover Further?
TradingKey - On the second day of the Dreamforce conference in San Francisco, Salesforce (CRM) experienced an outage in parts of its cloud software suite, leaving customers unable to access services properly. This software leader, which builds its core narrative around "customer relationship management," suffered a service availability issue right in the middle of its key showcase window for clients.
Incident tracking information on Salesforce's status page showed that the issue first appeared at 7:50 UTC, or 3:50 a.m. EDT. The service prompt at the time stated that customers across the company's three major operating regions might be affected, primarily concentrated in the United States, manifesting as severe access latency, intermittent error messages, and unaccessibility to certain services.
At 6:56 a.m. EDT, Salesforce updated that its engineering team had identified a fix for the issue, tested and verified in a controlled environment that it indeed resolved the problem, and was deploying the solution across all regions.
The timing of this outage was rather delicate. Dreamforce is Salesforce's flagship annual tech conference, which has grown into one of the company's most important commercial and marketing platforms since its inception in 2003. For an enterprise software firm that has long championed "customer success," a service outage during the conference directly hits the capability it wants to prove to clients most—platform stability and availability.
Salesforce's client list reportedly includes global giants across various industries, such as Amazon, Walmart, Coca-Cola, Toyota, and IBM. This outage comes as adding insult to injury for the SaaS company.
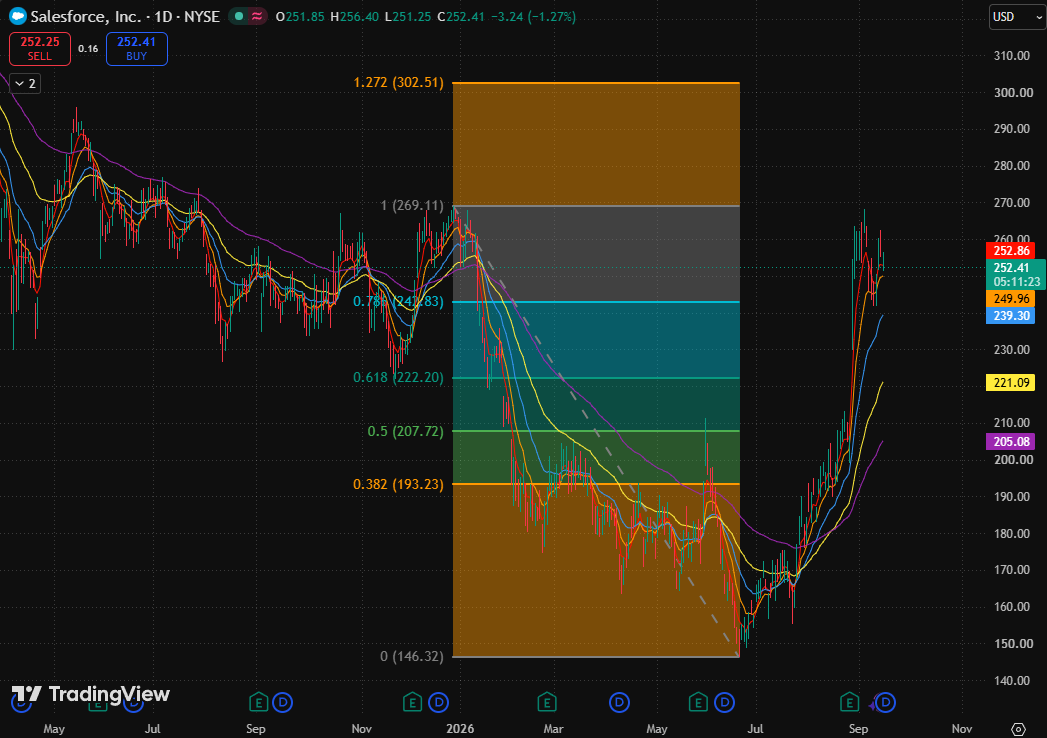
Salesforce stock price chart, Source: TradingView
From the stock price chart, Salesforce's upward trend remains relatively strong, but it has currently entered a stage of confirming resistance at previous highs. The prior rebound should not be equated with a new, unhindered main upward wave.
From the daily chart structure, after forming a periodic bottom near $146.32, CRM developed a rebound trend with higher lows and higher highs. The price successively broke through multiple Fibonacci retracement levels and medium- to long-term moving averages, indicating that this recovery is not merely an oversold technical bounce, but rather a completed trend reversal.
Regarding moving averages, the 10-day, 20-day, 80-day, and 160-day moving averages are all below the current price, with short- and medium-term moving averages trending upward overall, keeping the daily bullish structure intact. Only the shortest-term momentum has weakened; the price is currently below the 5-day moving average ($252.86), showing a pullback after an accelerated move higher.
Support below lies at the 0.786 Fibonacci retracement level ($242.83). As long as this position and the 10-day moving average ($249.96) hold, this pullback is better defined as short-term consolidation within a strong trend. If $242.83 is lost, the momentum of the rebound will cool down significantly, and the price may retest the 20-day moving average ($239.30).
On the bullish side, if it can regain a firm footing around $256.40 and effectively break above $269.11, the rebound is expected to further target the 1.272 Fibonacci extension level ($302.51).
Recommended Articles


