


The Stock Market Is Sending a Rare Historical Warning. Warren Buffett Says Investors Should Make This 1 Move.
Key Points
Major market indexes are beginning to stumble amid renewed volatility.
History suggests we could be nearing dot-com bubble territory.
Warren Buffett's 1999 warning and advice is perhaps more relevant than ever.
- 10 stocks we like better than S&P 500 Index ›
After years of seemingly unstoppable growth, major market indexes have faltered. The S&P 500 (SNPINDEX: ^GSPC), Dow Jones Industrial Average (DJINDICES: ^DJI), and Nasdaq Composite (NASDAQINDEX: ^IXIC) all slipped into the red over the last month, each down between 1% and 2%, as of this writing.
There's no shortage of reasons why the market is struggling. New fears around AI are rattling tech stocks, oil prices are reaching new highs, uncertainty in the bond market is pushing yields to dangerous thresholds, and it's all but certain the Federal Reserve will hike interest rates this week.
Missed AI’s "Act 1"? Act 2 Could Be 15x Bigger. Most investors think they missed the AI boat because they didn't buy Nvidia in 2005. But according to our analysts, we’re only at the end of "Act 1"—the R&D phase. "Act 2" is the global rollout. Continue »
While the market has remained resilient through much of this volatility, it's also been sending a quiet warning in the background. The good news, though, is that Warren Buffett has some timeless advice for moments exactly like this.
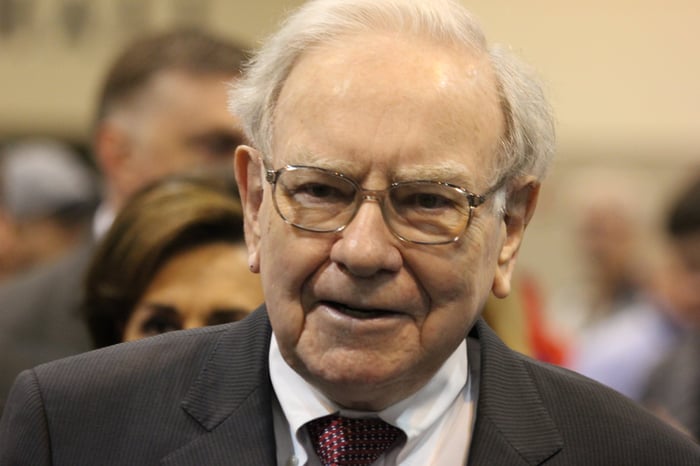
Image source: The Motley Fool.
Valuations are nearing dot-com bubble levels
The S&P 500 Shiller CAPE Ratio is a metric that tracks the broader market's long-term valuation. Like any metric, it's not perfect and can't predict the future. That said, its warnings have preceded some of the most severe bear markets and recessions in history.
The higher this figure climbs, the more likely the market is overvalued. It reached its first major peak in 1929, just before the Great Depression. About 70 years later, it surged again during the dot-com bubble. It hit a record high of 44 in late 1999, around four months before the bubble officially popped. Right now, this ratio is at just over 40.
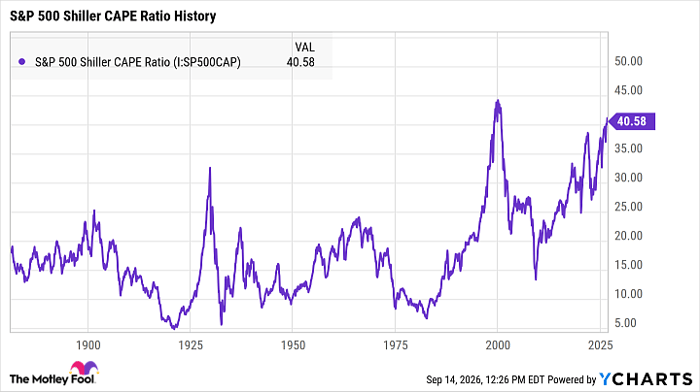
S&P 500 Shiller CAPE Ratio data by YCharts
Although it's incredibly rare for this metric to surpass 40, it doesn't mean a market crash is imminent. However, it does suggest that the market is nearing valuation levels seen only during the dot-com bubble.
Warren Buffett's single best piece of advice right now
During the dot-com boom, many investors were more excited about the internet's potential than they were concerned about a bubble. Tech stocks were unstoppable, initial public offerings (IPOs) were lucrative, and there was no shortage of hype around this new technology.
Then, in a 1999 Fortune article, Warren Buffett warned that many investors were likely buying for the wrong reasons. He used the airline industry as an example, noting that while air travel had transformed society, 129 airlines had gone bankrupt over the previous 20 years. The dot-com bubble later proved his point, as hundreds of tech stocks crashed and burned in the early 2000s.
"The key to investing," Buffett advised, "is not assessing how much an industry is going to affect society, or how much it will grow, but rather determining the competitive advantage of any given company and, above all, the durability of that advantage."
As concerns around an AI bubble mount, this advice is perhaps more important than ever. No matter how transformative a technology may be, it's crucial to ensure you're only investing in quality companies with strong foundations.
Should you buy stock in S&P 500 Index right now?
Before you buy stock in S&P 500 Index, consider this:
The Motley Fool Stock Advisor analyst team just identified what they believe are the 10 best stocks for investors to buy now… and S&P 500 Index wasn’t one of them. The 10 stocks that made the cut could produce monster returns in the coming years.
Consider when Netflix made this list on December 17, 2004... if you invested $1,000 at the time of our recommendation, you’d have $433,160!* Or when Nvidia made this list on April 15, 2005... if you invested $1,000 at the time of our recommendation, you’d have $1,296,254!*
Now, it’s worth noting Stock Advisor’s total average return is 949% — a market-crushing outperformance compared to 212% for the S&P 500. Don't miss the latest top 10 list, available with Stock Advisor, and join an investing community built by individual investors for individual investors.
See the 10 stocks »
*Stock Advisor returns as of September 16, 2026.
Katie Brockman has no position in any of the stocks mentioned. The Motley Fool has no position in any of the stocks mentioned. The Motley Fool has a disclosure policy.
Recommended Articles


