


Why Nike Stock Hit a 12-Year Low, Down 78% From Its 2021 Peak
TradingKey - Nike (NKE), which once swept global markets with "Just Do It" and the Air Jordan series, is now undergoing a prolonged slump rarely seen since its public listing.
On August 17, Nike's stock closed at $39.09, down about 4% for the day, after touching $38.86 intraday to hit a new low in nearly 12 years. Compared with its record high of $177.51 in November 2021, its cumulative decline has reached nearly 78%, with its value shrinking by nearly half over the past year.
Although this decline was affected by weaker performance and guidance from competitor On Holding (ONON), the deeper root cause remains Nike's own unresolved operational issues. Soft performance in the Chinese market, changing consumer preferences, direct-to-consumer strategies failing to meet expectations, and emerging sportswear brands continuing to capture market share have all made Nike's path to recovery longer than the market previously anticipated.
Industry Concerns Spread Quickly as Rivals' Earnings Cool
The immediate trigger for Nike's stock falling below $40 came from Swiss sportswear brand On Holding. The company's second-quarter sales stood at $1.076 billion, missing market expectations of $1.11 billion; its full-year 2026 revenue guidance of approximately $4.39 billion to $4.5 billion also failed to instill sufficient confidence among investors.
Although On's earnings per share beat expectations, the market was more focused on its revenue growth rate and forward guidance. As a fast-growing brand in the premium running shoe market in recent years, On's cautious forecast sent a negative signal that, amid increasingly conservative consumer spending, even emerging brands with strong momentum are starting to feel the pressure of slowing demand.
This further triggered a reevaluation by investors of the entire athletic footwear and premium sportswear industry. Compared with On, which remains in an expansion phase, Nike itself faces issues such as brand aging, inventory adjustments, and channel restructuring, making the market even more cautious about its capacity for earnings recovery.
Nike China Revenue Declines as DTC Strategy Remains Under Pressure
Greater China remains Nike's most challenging market. In fiscal 2026, Nike generated $5.85 billion in revenue in the region, down 11% year-over-year; excluding exchange rate fluctuations, the decline reached 13%. Among this, direct-to-consumer digital sales fell 29%, footwear revenue dropped 14%, and operating profit in Greater China also slid 20% to $1.28 billion.
These figures indicate that Nike is facing more than just short-term consumer weakness in China. Local sportswear brands such as Anta and Li-Ning are steadily narrowing the gap with international brands, leveraging more flexible product strategies, rapid iteration capabilities, and a deep understanding of local consumers. The premium brand aura and channel advantages Nike once possessed are gradually eroding.
Meanwhile, elevated inventory levels have also constrained Nike's room for adjustment. To clear out older products, the company has had to increase discounts and promotional intensity, which not only depresses margins but could also damage the brand's long-established premium pricing power. Under the dual pressure of intensifying competition and diverging demand, the recovery of its China business has been noticeably slower than investors expected.
In addition, Nike has continuously pushed its DTC (direct-to-consumer) model in recent years, hoping to boost profit margins and strengthen connections with consumers through company-owned stores, apps, and online marketplaces, but the actual results have been less than ideal.
In fiscal 2026, Nike's direct sales revenue declined year-over-year, with digital business performance particularly weak as Nike brand online sales fell by about 12%. Meanwhile, its wholesale business actually grew. This means that the channel transformation heavily promoted by the company in the past has not yet generated the expected growth momentum.
Nike Stock Technical Analysis: Will NKE Stock Rebound?
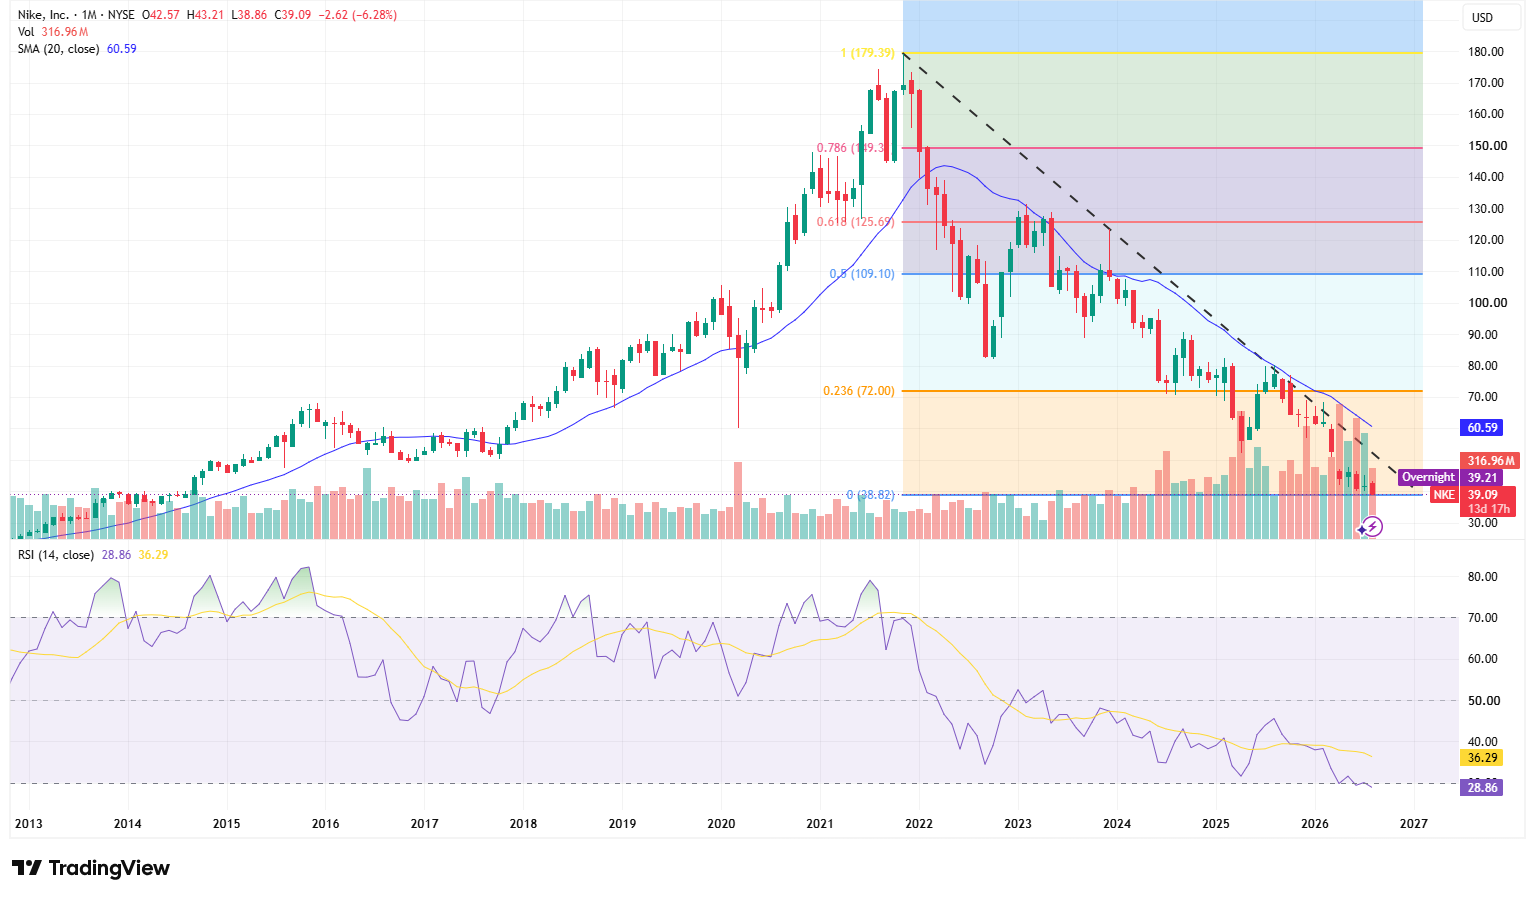
Source: TradingView
From the monthly chart perspective, Nike's share price has been trending downward since reaching its all-time high in 2021, forming a series of lower highs and lower lows that clearly define a long-term downtrend. Although temporary rallies occurred in 2022 and 2023, the stock consistently failed to break above the downtrend line, indicating that the gains were primarily bear market rallies that did not reverse the long-term weak structure.
Nike's stock recently dropped to $39.09, down 6.28% so far this month, trading well below its declining 20-month moving average and breaching its pandemic-era low of $50.14. This means the entire rally from 2020 to 2021 has been virtually wiped out. The recent decline has been accompanied by increased trading volume, indicating that the breakdown is supported by capital outflows rather than thin market liquidity.
In addition, the monthly RSI has dropped to 28.86, entering the oversold territory below 30, which suggests an increasing likelihood of a technical rebound following a sharp short-term decline. However, the RSI remains below its signal line of 36.29 and has not yet shown a clear bullish divergence. Therefore, an 'oversold' reading merely indicates a significant drop and does not directly prove that the stock has bottomed out. Within a long-term downtrend, the RSI can remain depressed for an extended period.
To the downside, the immediate support zone to watch is $38.82–$39. If the monthly chart holds this level and forms a distinct lower shadow, NKE could see an oversold rebound; if it suffers a decisive breakdown, the next historical support levels to monitor are $34–$36, followed by the $30–$32 region.
To the upside, the initial resistance lies at $43–$45, which is close to both the recent breakdown platform and the downtrend line. A breakout above this area would bring the $50 psychological mark into focus, followed by the 20-month moving average at $60.59. Only a sustained recovery above the 20-month moving average would point to a meaningful improvement in the long-term trend. The 0.236 Fibonacci retracement level at $72 serves as strong medium-term resistance; if broken in the future, subsequent targets could extend toward $92.52 and $109.10.
Recommended Articles


