

SpaceX Stock Forecast: Push Toward $150 Stalls, Short-Term May Retest $100 Support

Source Tradingkey

TradingKey - SpaceX stock retreats after a surge and may test $135 or lower in the short term.

On August 14 Eastern Time, SpaceX (SPCX) stock continued to fluctuate, rising 0.86% in pre-market trading to $142.51. On Wednesday (August 12), Musk claimed that AI revenue next month would surpass Starlink and rocket launches, Starlink and rocket launches, driving SpaceX stock up nearly 10% to an intraday high of $148.79, approaching its first-day opening price of $150 and hitting a one-month high.

Currently, SpaceX is locked in a high-level tug-of-war before the $150 round-number level and showing signs of a pullback, reflecting strong resistance at this position with a large backlog of potential selling pressure. The two main sources are breakeven selling around the IPO opening price level and potential selling following the initial lockup expiration.

On June 12, SpaceX opened at $150 on its IPO debut and surged rapidly during the day, reaching a high of $176. This indicates that $150 accumulated a significant amount of trapped capital buying at high levels. As the stock strongly rebounded from its early August low to its current position, trapped positions and short-term profit-takers sought to break even simultaneously, creating strong psychological and technical resistance.

In addition, around 911 million insider and employee shares were unlocked in early August. Although the market absorbed the initial wave of selling pressure, executives and early VC capital have a strong desire to lock in profits in tranches above $150, which also limits short-term upside momentum.

For SpaceX, the current lack of major catalysts combined with potential selling pressure from multiple forces leaves its stock under significant pressure. From a technical analysis perspective, SpaceX stock pulled back after testing the 0.382 Fibonacci resistance level and will correct downward to around $135 in the short term, which is SpaceX's IPO price and also the 0.236 Fibonacci resistance level. If it breaks below this level, it will return to near the $100 mark, the starting point of the rebound.
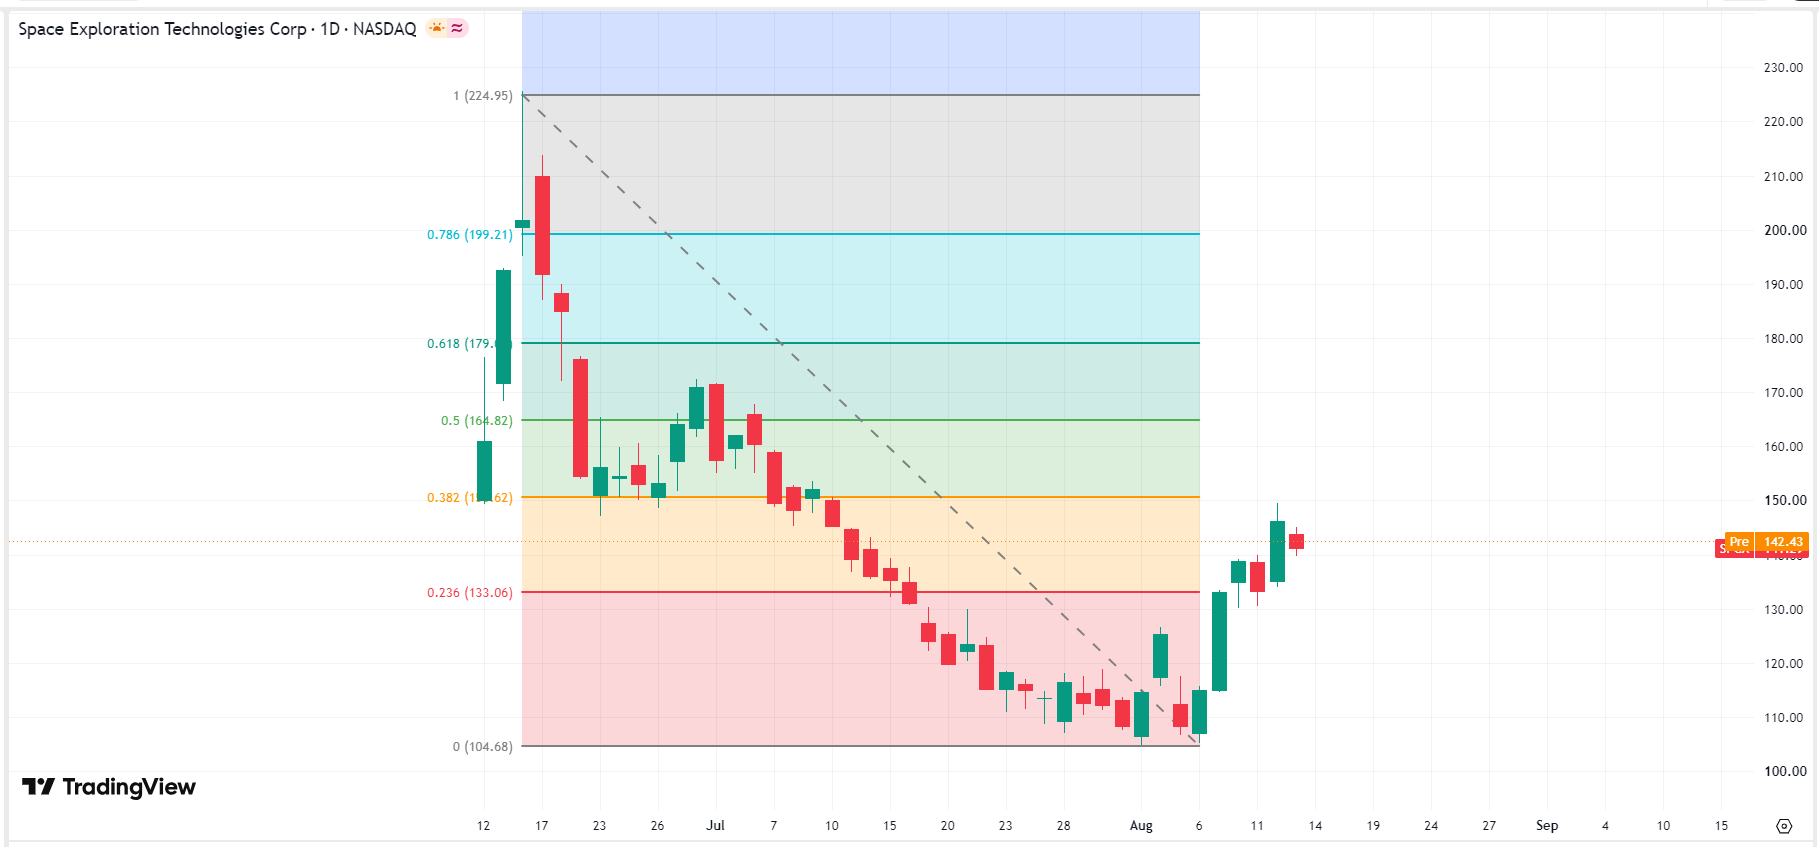
spacex-spcx-price-21413bd3e0b546c7a3878d5cf9fbd88cSpaceX stock chart, Source: TradingView

Disclaimer: For information purposes only. Past performance is not indicative of future results.
placeholder
Gold Price Analysis Today: Gold Drops 1.32% Despite Lower Fed Rate-Hike Bets, Can $4,313 Support Hold? Gold fell 1.32% on August 13 after rising to $4,449.73, then reversing lower and closing near $4,349.918 below the $4,356.46 support. Softer US inflation data reduced Fed rate hike expectations, but selling pressure still dominated the session. Will $4,313 support hold?
Author  Naoufal Seddik
9 hours ago
Gold fell 1.32% on August 13 after rising to $4,449.73, then reversing lower and closing near $4,349.918 below the $4,356.46 support. Softer US inflation data reduced Fed rate hike expectations, but selling pressure still dominated the session. Will $4,313 support hold?
placeholder
XAUUSD Gold Analysis: Gold Holds Above $4,350 Ahead of US Inflation Data Is $4,500 Next? Gold holds above $4,350 following weak US jobs data. As inflation reports approach and UBS eyes $5,000, can XAUUSD break resistance at $4,435 to rally toward $4,500?
Author  Naoufal Seddik
Aug 12, Wed
Gold holds above $4,350 following weak US jobs data. As inflation reports approach and UBS eyes $5,000, can XAUUSD break resistance at $4,435 to rally toward $4,500?
placeholder
Intel Price Forecast: Nvidia Picked Xeon 6, Invested $5B, Yet Analysts Still Trail INTCIntel Corporation (NASDAQ: INTC) sits at $140.05, holding firm on the ascending trendline within the 2H timeframe. The RSI indicator is currently reading 55.21, positioning it as neutral-
Author  TradingKey
Jul 02, Thu
Intel Corporation (NASDAQ: INTC) sits at $140.05, holding firm on the ascending trendline within the 2H timeframe. The RSI indicator is currently reading 55.21, positioning it as neutral-
placeholder
NVIDIA Price Forecast: Michael Burry Shorts NVDA, but Analysts See $299On July 1, NVIDIA (NASDAQ: NVDA) sits at $198.34, failing to break above the former support level that is now serving as resistance between $198 and $205 on the 2H chart's downward blue c
Author  TradingKey
Jul 02, Thu
On July 1, NVIDIA (NASDAQ: NVDA) sits at $198.34, failing to break above the former support level that is now serving as resistance between $198 and $205 on the 2H chart's downward blue c
placeholder
Meta Compute Launch Sends AI Compute Stocks Tumbling GloballyMeta’s plan to sell surplus computing power hit chip stocks hard on Wall Street. Meta’s own shares climbed nearly 9% on the news.The announcement flipped years of assumed AI compute scarcity into a su
Author  Beincrypto
Jul 02, Thu
Meta’s plan to sell surplus computing power hit chip stocks hard on Wall Street. Meta’s own shares climbed nearly 9% on the news.The announcement flipped years of assumed AI compute scarcity into a su
goTop
quote