


Cerebras Systems Stock Price Forecast: Breaks $248 Resistance, Can Q2 2026 Earnings Push Stock Back to $300?
TradingKey - On August 12 Eastern Time, Cerebras Systems (CBRS), which went public in May this year, will release its second-quarter fiscal 2026 financial results after the market close. According to previous company guidance, its second-quarter core revenue is expected to be approximately $194 million, representing an 88% year-over-year increase.
The market is watching whether the company can achieve margin improvement this quarter after securing major clients such as OpenAI. Cerebras stated in its previous earnings report that its core gross margin for the second fiscal quarter would drop significantly to between 36% and 38%, far below the 46.5% level recorded in the first fiscal quarter. Meanwhile, core operating margin is expected to range between -30% and -32%.
The core reason for the sharp drop in gross margin is that, to meet the surging demand for AI inference before its self-built data centers become fully operational, the company had to temporarily lease and rely on customers' proprietary systems (such as expensive compute from G42) for delivery, which severely eroded profitability.
Multiple Wall Street investment banks are highly optimistic about the prospects of Cerebras Systems, giving it an overall consensus rating of "Strong Buy." Currently, a total of 10 analysts rate Cerebras Systems, with the highest price target at $340, representing an upside potential of about 31% from current levels. The lowest price target is $273.00, which also implies an upside of about 5%, and the average price target stands at $297.56.
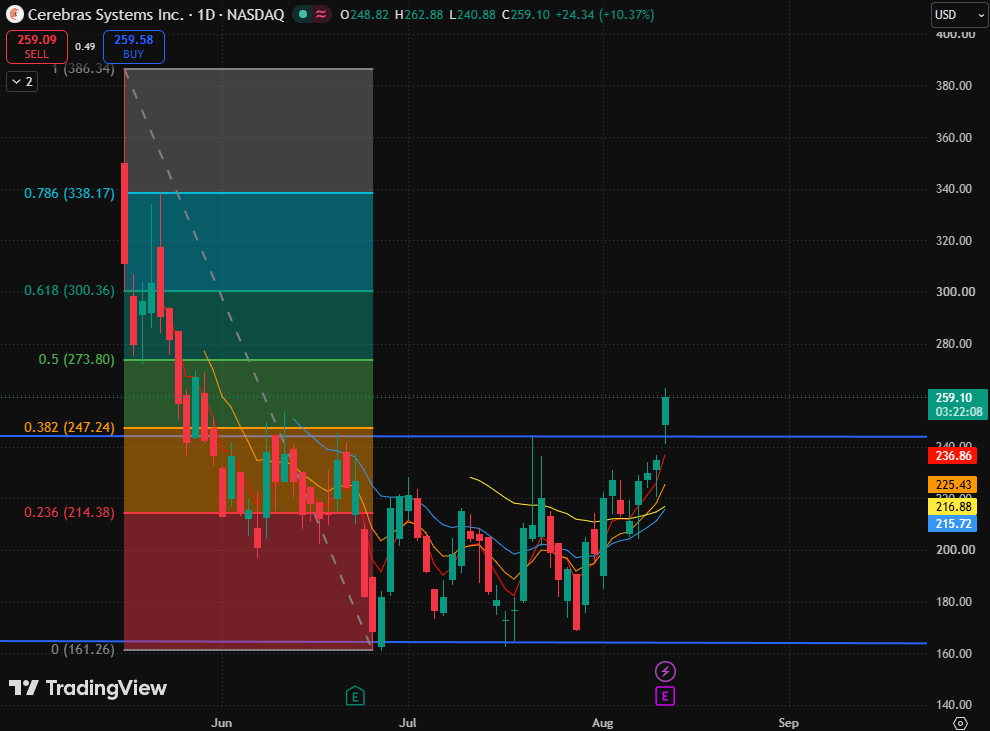
Cerebras stock chart, Source: TradingView
Looking at the Cerebras stock chart, the price has broken above the 0.382 Fibonacci retracement level ($247.24) and moved above its 5-day, 10-day, 20-day, 40-day, and 80-day moving averages. In the short term, it has transitioned from a low-level rebound into a strong recovery phase.
Regarding the moving averages, the 5-day and 10-day moving averages are fanning upward, while the 20-day, 40-day, and 80-day moving averages sit in the $215–$236 range, turning from previous resistance into a support zone below.
In the short term, primary support has shifted upward to the 0.382 Fibonacci retracement level ($247.24). If the daily chart holds firm after a pullback, it indicates a valid breakout, giving the stock a chance to continue challenging the 0.5 Fibonacci retracement level ($273.80).
On the upside, if $273.80 is effectively broken, the next resistance will target the 0.618 Fibonacci retracement level ($300.36), followed by the 0.786 Fibonacci retracement level ($338.17).
It should be noted that the company plans to report its financial results after the market close on August 12 Eastern Time, and the performance and guidance may amplify subsequent volatility. If the price falls back below the 0.382 Fibonacci retracement level ($247.24) after the earnings report, the validity of the breakout will be weakened, potentially retesting the moving average support zone near $236; if it further loses the 0.236 Fibonacci retracement level ($214.38), the current recovery structure will weaken significantly.
Recommended Articles


