


Apple Stock Price Forecast: Jefferies Downgrades Rating as iPhone 18 Pro Component Costs Rise Around 38%; Will Price Fall Further?
TradingKey - On August 10, Eastern Time, Apple's (AAPL) stock price has been hovering around $300 since its quarterly earnings report was released. However, Wall Street's bearish sentiment toward Apple is accelerating.
In its latest research report, Jefferies downgraded Apple to an "Underperform" rating and lowered its price target from $285.56 to $263.66, representing about 14% downside from the current stock price of $306.
Jefferies analyst Edison Lee pointed out that supply chain checks show Apple has canceled its 20th-anniversary all-glass iPhone model due to poor production yields. He believes this signal indicates that Apple's difficulty in raising the iPhone's average selling price (ASP) by introducing a new form factor is far greater than expected.
Edison Lee stated that the foldable iPhone, which Apple is expected to release next month, "will be the sole key driver to lift ASP and margins over the next few years." However, soaring prices of key components such as memory chips will force the product to be priced too high, adding, "we continue to believe such an expensive phone would be a niche product."
Meanwhile, market research firm TrendForce stated that the component cost of the 256GB iPhone 18 Pro will rise by about 38% compared to last year's iPhone 17 Pro, leading to an "inevitable" increase in retail prices. One reason for the price hike is Apple's adoption of TSMC's advanced 2-nanometer process technology in its custom A20 Pro chip. However, this is not the main driver; the real culprit behind the price surge is the substantial increase in memory prices compared to previous iPhone generations.
TrendForce stated: "Driven by soaring memory prices, the bill of materials cost for the 256GB iPhone 18 Pro, scheduled for release in the third quarter of 2026, is expected to be about 38% higher than its 2025 predecessor. If memory prices continue to rise, the bill of materials cost for the 256GB iPhone 18 Pro in 2027 is expected to increase further."
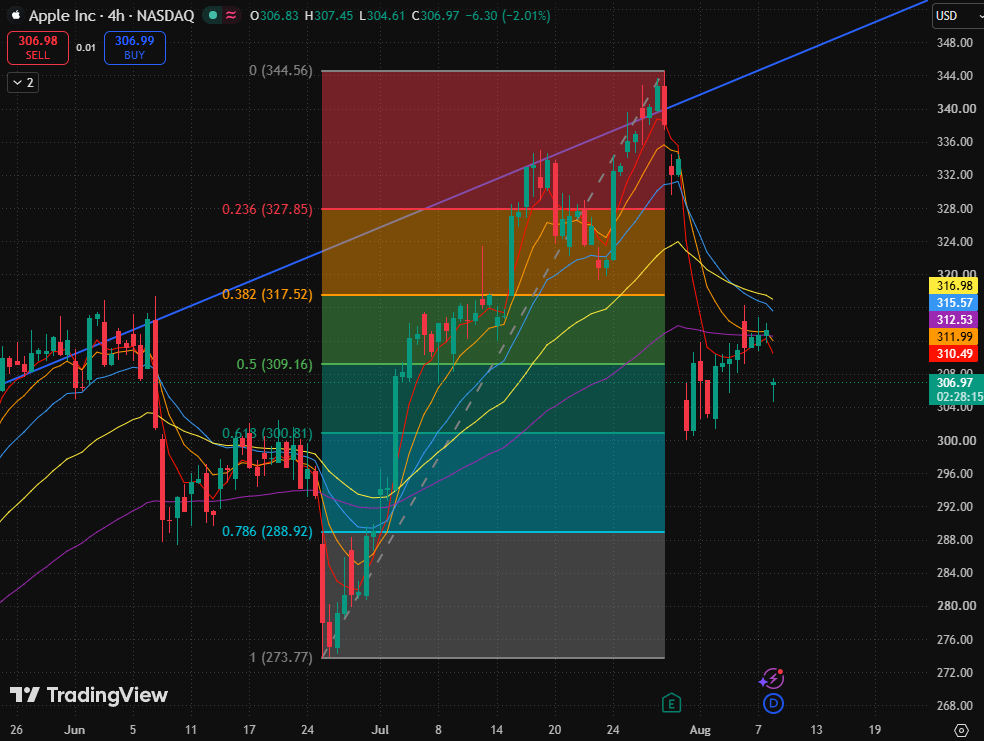
Apple 4-hour stock chart, Source: TradingView
After hitting a periodic high of $344.56, Apple's stock price experienced a significant retracement, falling below the 0.5 Fibonacci retracement level ($309.16) and trading below the 5-day, 10-day, 20-day, 40-day, and 80-day moving averages. Its short-term structure has further weakened from a high-level correction. Although there has been a brief rebound from the current low, no clear signal of stabilization or recovery has emerged.
Currently, the 5-day and 10-day moving averages are pointing downward, while the 20-day, 40-day, and 80-day moving averages are clustered around $312–$317, forming a dense overhead resistance band. The latest price is below all moving averages, indicating that short-term bears still dominate. The previous upward trendline has also been broken; if the price cannot reclaim $309.16 as soon as possible, the prior rebound should be viewed as a technical recovery after being oversold.
On the downside, the primary support to watch is the 0.618 Fibonacci retracement level ($300.81), which serves as a crucial line of demarcation between strength and weakness since the rebound from the low of $273.77. If $300.81 is lost, attention will turn to the 0.786 Fibonacci retracement level ($288.92) and the previous low of $273.77 in sequence.
Recommended Articles


