


SpaceX Stock Price Forecast: Why Shares Rise Against Trend Amid $100 Billion Unlock as Recovery May Continue
TradingKey - On August 6, Eastern Time, SpaceX ( SPCX) saw its largest post-IPO insider cash-out window open today. However, SPCX shares, after falling over 2% at the open, at one point reversed to rise over 6%. The stock hit an intraday low of $105.11, avoiding a touch of its all-time low of $104.83.
Morgan Stanley analyst Adam Jonas pointed out in a client note on Wednesday that this lock-up expiration involves approximately $100 billion worth of SpaceX shares, characterizing it as an entry opportunity to buy this "potential multi-generational compounding asset."
However, as SpaceX's stock price has now fallen below its IPO price of $135, another block of up to 455.8 million shares will remain locked up due to the triggering of price clauses, preventing them from being sold during this window.
It is worth noting that SpaceX adopted a staggered lock-up release mechanism that differs from traditional IPOs, rather than releasing all shares at once after the 180-day lock-up period expires. This design triggers additional protective clauses when the stock price performs poorly.
Since SpaceX's stock price has failed to return to its $135 IPO price since July 16, another block of up to 455.8 million shares will remain locked up.
According to the company's schedule, the next batch of lock-up expirations will occur on August 21, when approximately 7% of the shares will be released. SpaceX's overall 180-day lock-up period will expire in early December, while the extended lock-up period for CEO Elon Musk and certain specified shareholders will last until next June.
JPMorgan analyst Doug Anmuth wrote in a client note that he believes investors had already done "a significant amount of pre-positioning," which could mitigate some of the selling pressure from the lock-up expiration.
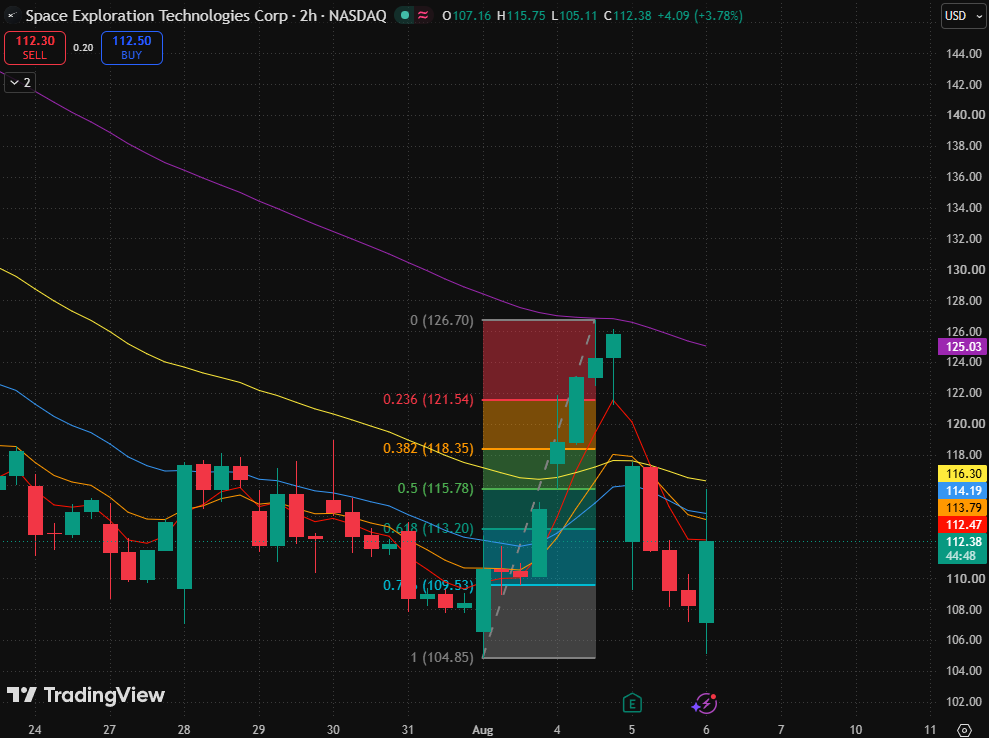
SpaceX two-hour stock chart, Source: TradingView
Looking at the SpaceX stock chart, the stock rebounded after hitting an all-time low of $104.85, then quickly pulled back from a high of $126.70. The rebound has not yet reclaimed the medium-to-long-term moving average resistance zone. Overall, it remains in a recovery phase following a sharp decline; while short-term stabilization signals have begun to emerge, a trend reversal is yet to be confirmed.
Currently, the stock price has climbed back above the 0.786 Fibonacci retracement level ($109.53), but remains below the 0.618 Fibonacci retracement level ($113.20), which constitutes the most immediate bull-bear dividing line.
In terms of moving averages, the 5-day moving average has begun to turn upward, indicating some return of short-term buying power. However, the 10-day, 20-day, 40-day, and 80-day moving averages are still clustered in the $113–$125 area, forming heavy overhead resistance. If the stock price cannot effectively reclaim $113.20, the current rise is still more of a technical rebound after a breakdown.
The primary short-term support is at the 0.786 Fibonacci retracement level ($109.53), which is also the key line of defense for whether the current rebound structure can continue. Holding this level could pave the way for a challenge toward the 0.618 Fibonacci retracement level ($113.20).
If $113.20 is further reclaimed, attention should be paid to the overhead targets in sequence: the 0.5 Fibonacci retracement level ($115.78), the 0.382 Fibonacci retracement level ($118.35), and the 0.236 Fibonacci retracement level ($121.54).
If $109.53 is lost, it would indicate that low-level rebound momentum is weakening, and the market may retest the previous low of $104.85. Only a consecutive hold above $113.20, followed by reclaiming $115.78, would provide stronger confirmation of a short-term structural shift from oversold recovery to trend improvement.
Recommended Articles


