


Pump.fun Price Prediction: PUMP trims gains amid fading retail interest
- Pump.fun corrects toward $0.0022 against the backdrop of a rejection at $0.0026.
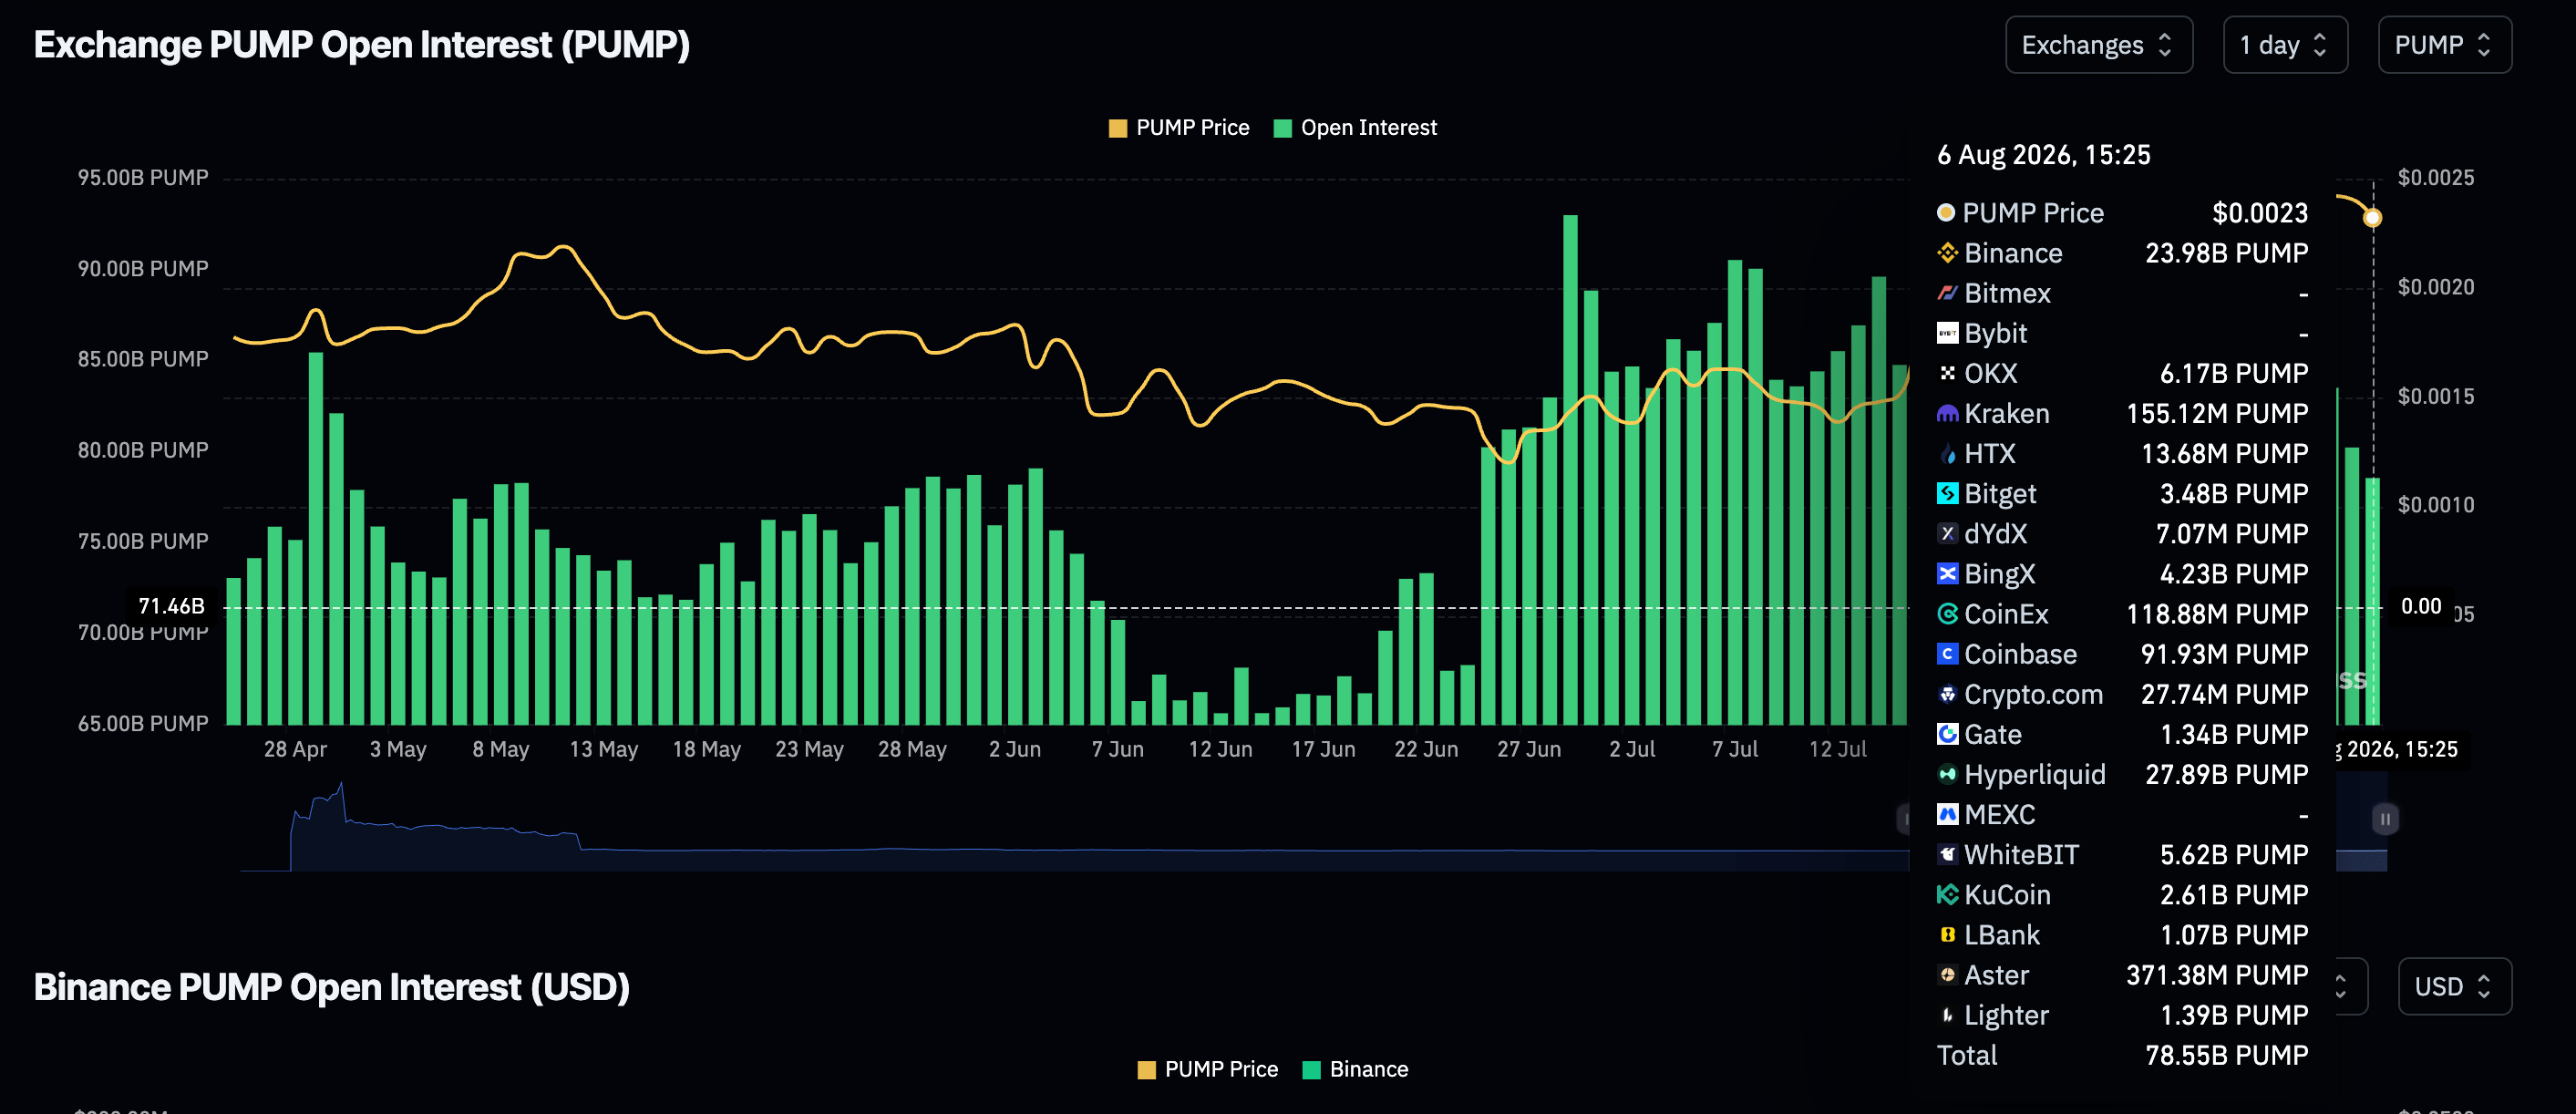
- Retail investors reduce risk exposure as perpetual futures Open Interest drops to 78.55 PUMP.
- PUMP’s technical structure remains relatively bullish, supported by a MACD buy signal.
Pump.fun (PUMP) continues to face downward pressure, trading near $0.0023 at the time of writing on Thursday. Following a rejection below the $0.0026 supply zone on Wednesday, the native token of the meme coin launchpad has shed approximately 10% of its recent gains, weighing on investor sentiment.
Establishing a stronger support level is critical to stabilizing price action and improving the likelihood of a sustained recovery.
PUMP falters as retail support softens
The Pump.fun derivatives market is cooling with perpetual futures Open Interest (OI) averaging 78.55 billion PUMP on Thursday, down from 80.23 billion PUMP the previous day and 83.51 billion PUMP on Tuesday. If sustained, declining retail demand may add to the current headwinds, increasing the odds of an extended sell-off.
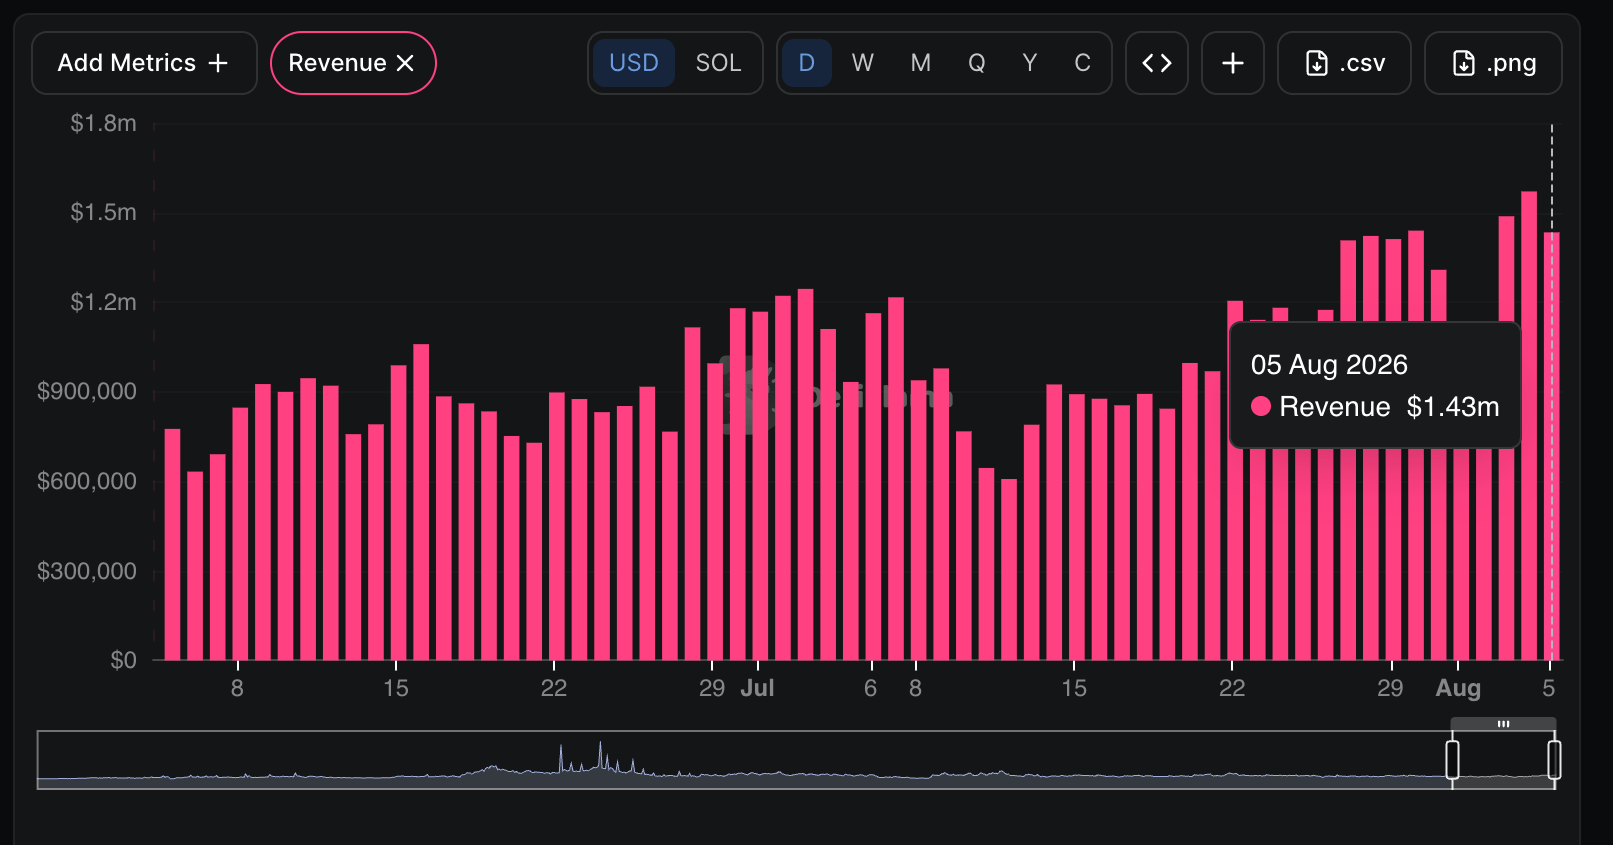
Meanwhile, the platform revenue peaked at $1.57 million on Tuesday, marking the highest level in August before cooling to $1.43 million on Wednesday. Pump.fun revenue plays a vital role in the network’s buyback program to reduce PUMP’s circulating supply.
PUMP upside capped as bears gain ground
PUMP holds above a dense support cluster, with the SuperTrend at $0.0019 aligned with the 200-day Exponential Moving Average (EMA) at $0.0019 and the 100-day and 50-day EMAs around $0.0018, which collectively suggest a constructive near-term bias as price extends away from these reclaimed trend levels.
The Relative Strength Index (RSI) around 66 sits just shy of overbought territory, hinting at firm but not yet overstretched bullish momentum, while the Moving Average Convergence Divergence (MACD) hovers around the zero line with a flat profile, reinforcing a steady, rather than explosive advance.
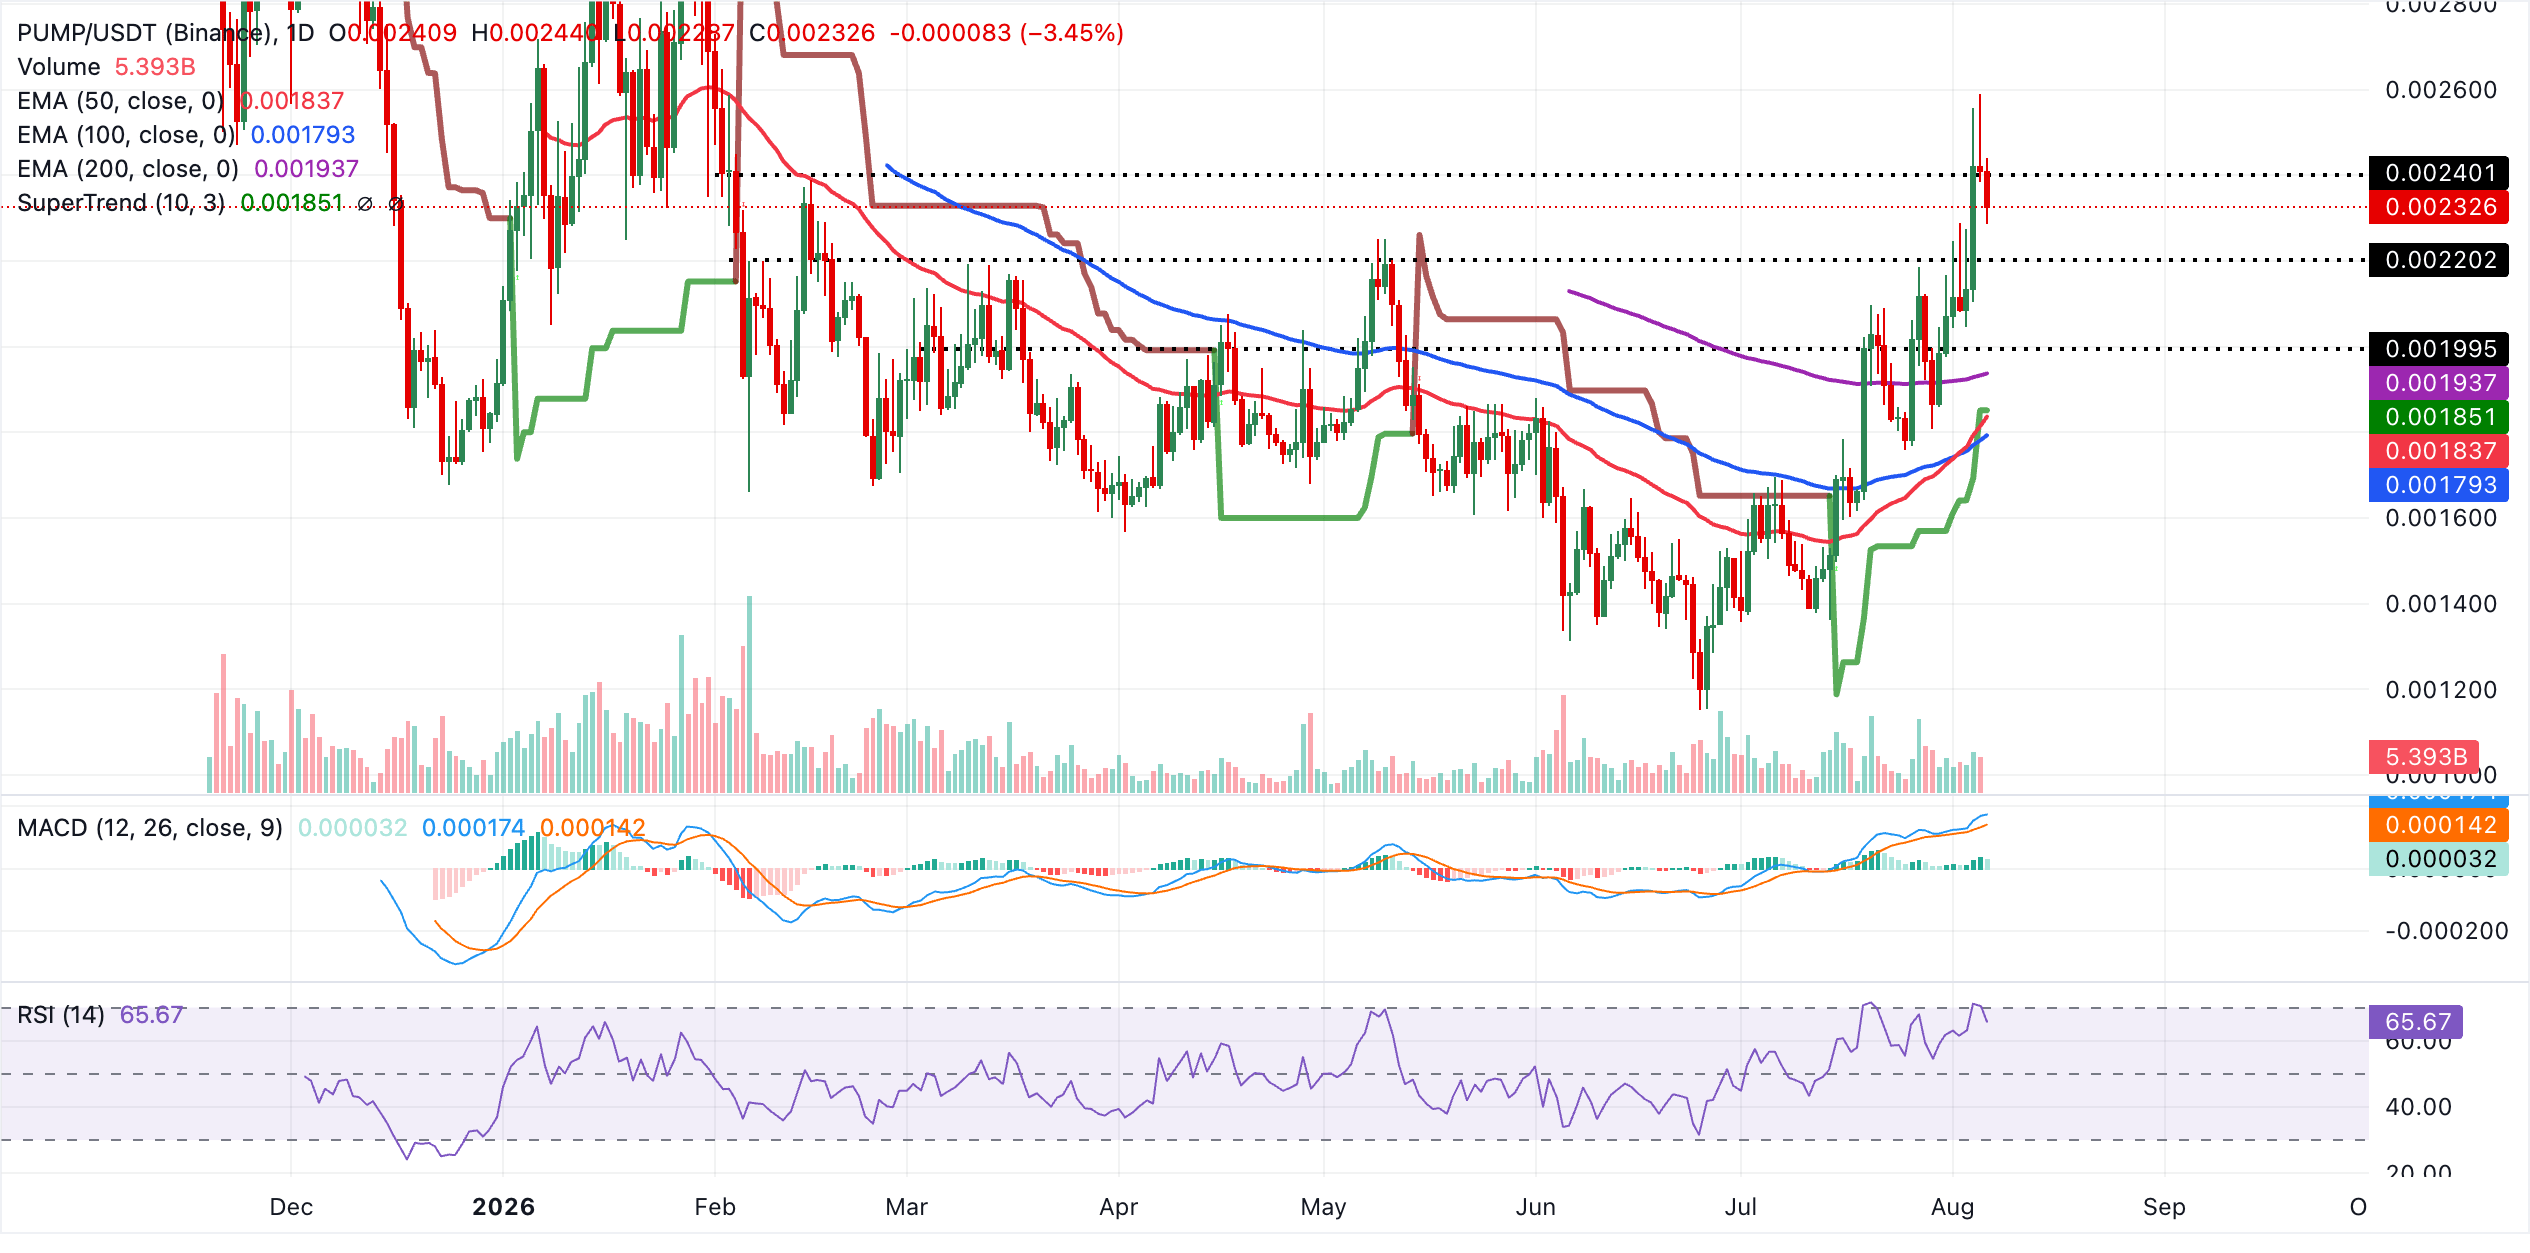
Initial demand is seen in the $0.0019 area, where the SuperTrend and 200-day EMA form the first significant support band, followed by secondary technical support around $0.0018 at the 100-day and 50-day EMAs. As long as PUMP holds above this broader $0.0018-$0.0019 base, buyers are likely to defend shallow pullbacks, keeping the focus on continuation higher, even though fresh topside resistance has yet to be clearly defined on the current daily setup.
Momentum is improving on the weekly chart, with the RSI near 59 and the MACD showing a marginal positive reading, which hints at waning selling pressure but not yet a clear bullish reversal while these overhead levels remain intact.
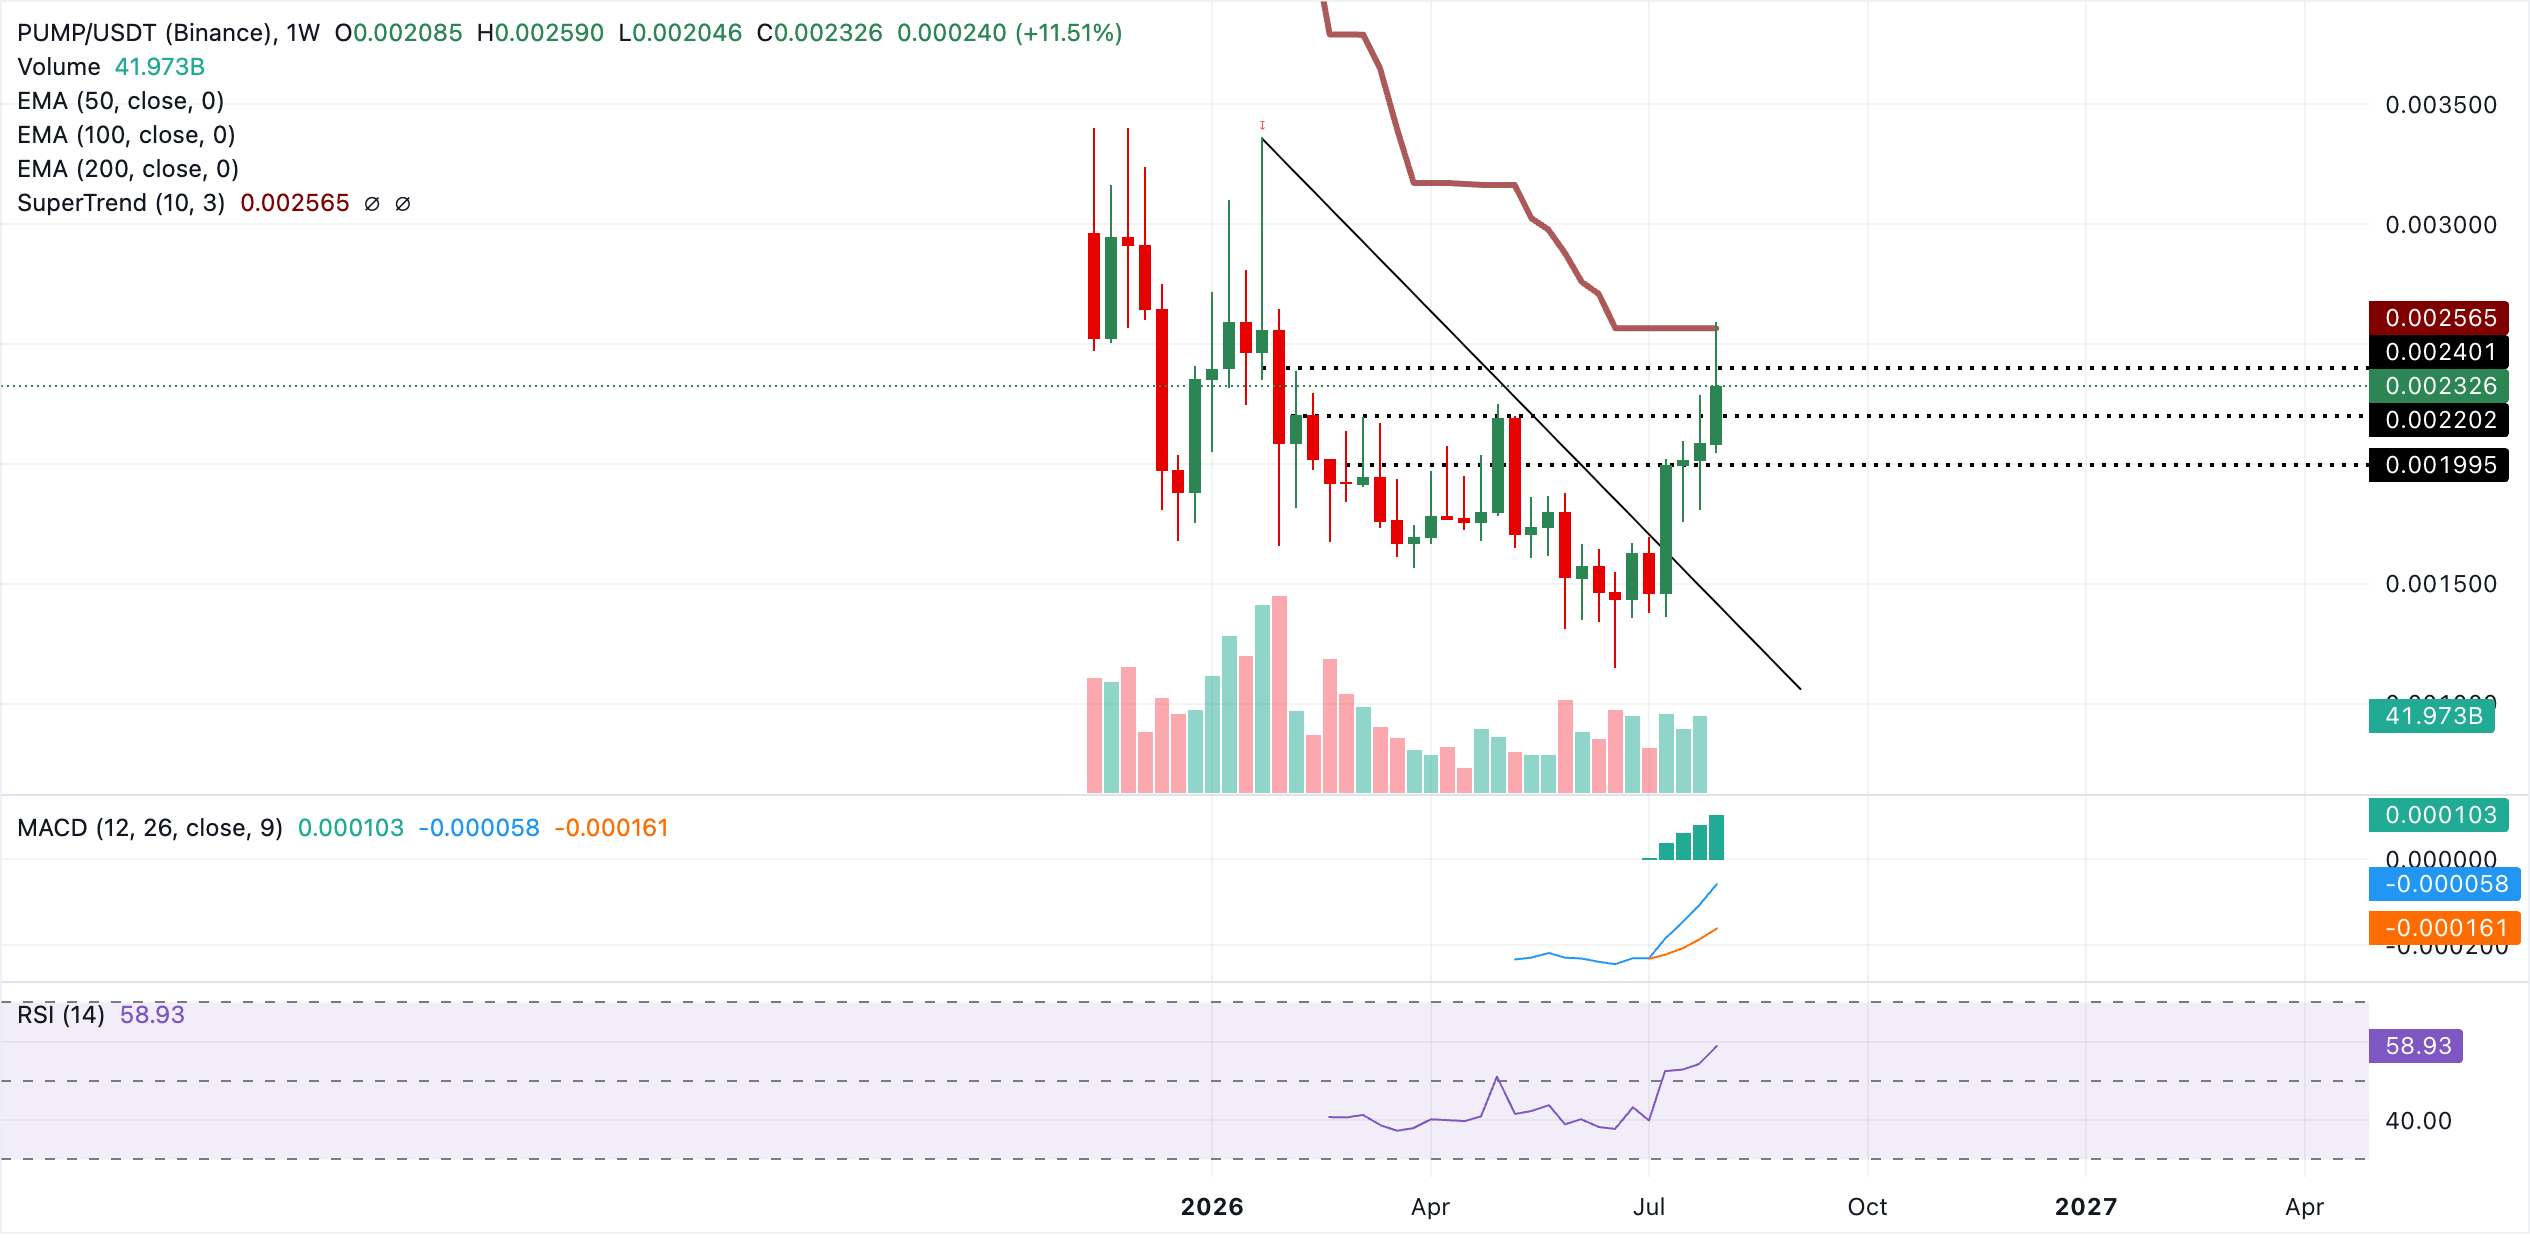
Initial resistance lies at the SuperTrend barrier around $0.0026, followed by stronger supply near the downtrend structure towards $0.0034. On the downside, the main structural floor is defined by the prior trendline break area near $0.0014, where a return would likely attract dip‑buyers. A sustained move above $0.0026 would be needed to ease the current bearish bias and open the way for a broader recovery.
(The technical analysis of this story was written with the help of an AI tool. Know more.)
Open Interest, funding rate FAQs
Higher Open Interest is associated with higher liquidity and new capital inflow to the market. This is considered the equivalent of increase in efficiency and the ongoing trend continues. When Open Interest decreases, it is considered a sign of liquidation in the market, investors are leaving and the overall demand for an asset is on a decline, fueling a bearish sentiment among investors.
Funding fees bridge the difference between spot prices and prices of futures contracts of an asset by increasing liquidation risks faced by traders. A consistently high and positive funding rate implies there is a bullish sentiment among market participants and there is an expectation of a price hike. A consistently negative funding rate for an asset implies a bearish sentiment, indicating that traders expect the cryptocurrency’s price to fall and a bearish trend reversal is likely to occur.
Recommended Articles


