

SpaceX Shares Rise Over 3% as More Than 900 Million Shares Set to Be Unlocked

Source Tradingkey

TradingKey - SpaceX's stock rises over 3% even as its first unlocked shares are about to enter the public float.

On August 6, Eastern Time, SpaceX ( SPCX) stock price rose instead of falling as the lock-up expiration approached, surging over 3% in pre-market trading to climb back above $110, temporarily trading at $112.03. Yesterday, affected by the released financial report, SpaceX's stock price plummeted over 13%, nearly falling below the $100 mark.
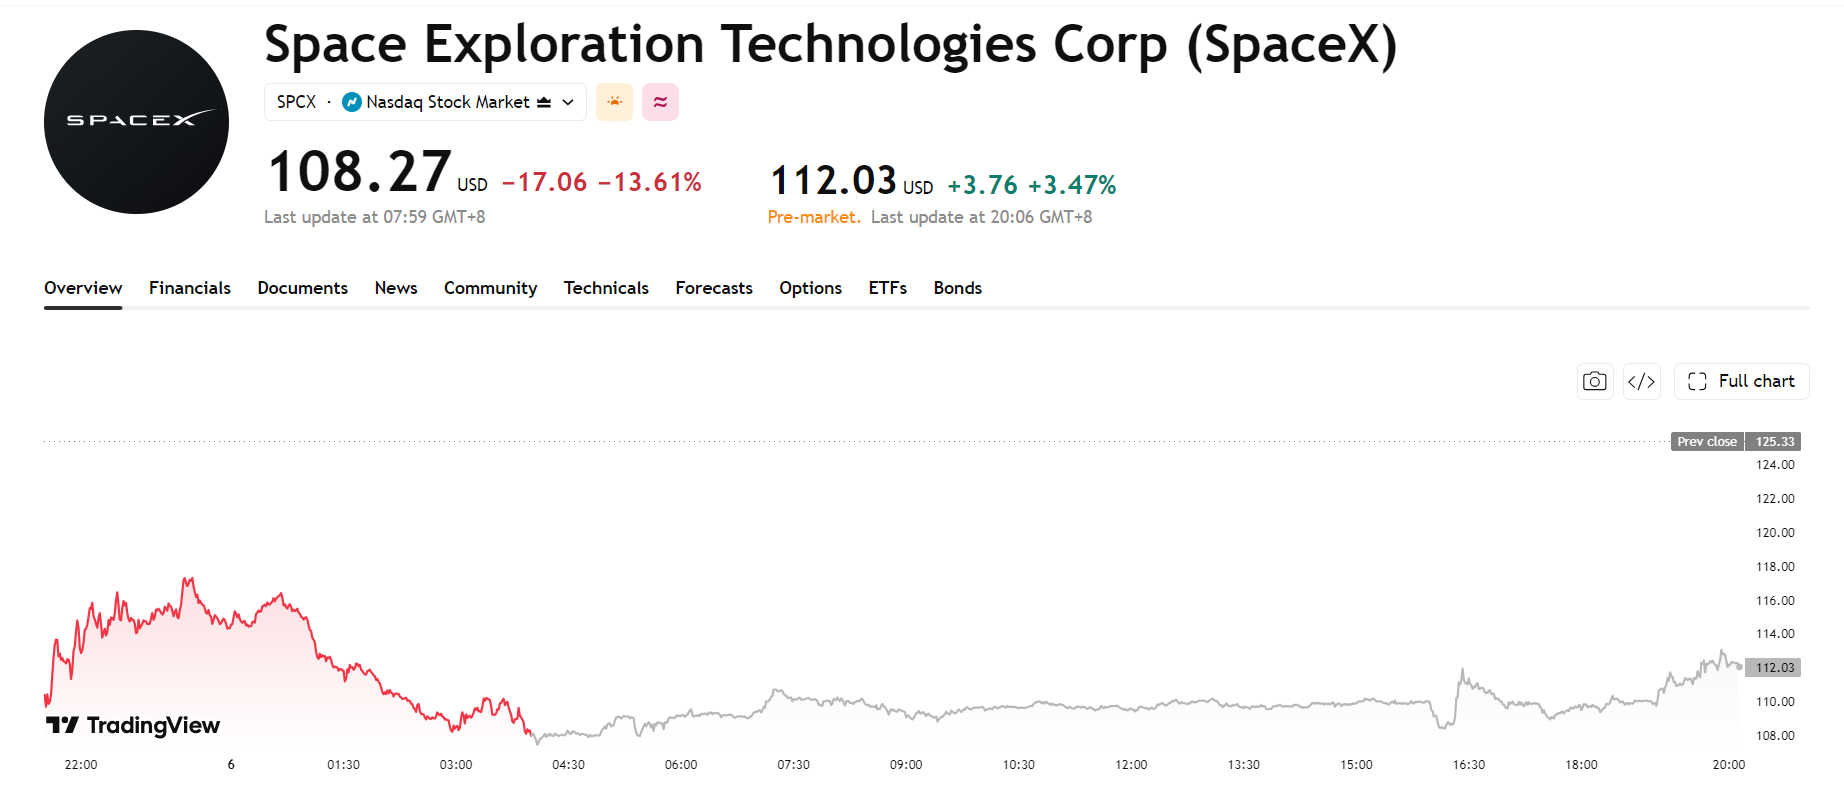
spacex-spcx-price-bcef79723e8d487d97dc6fc82f6edc4aSpaceX stock chart, Source: TradingView

At 9:30 AM Eastern Time on Thursday, August 6, SpaceX experienced its first wave of lock-up expirations, which is expected to release 911.5 million shares. This far exceeds the current public float of around 640 million shares, meaning SpaceX's public float is about to increase by 1.4 times. If all the newly unlocked shares are sold off, it will definitely have a massive impact on the stock price. However, the unlocked shares may not necessarily all be sold off.

Notably, today is only the first lock-up expiration for SpaceX, with three remaining rounds this year. The specific timing and quantities are as follows:

Lock-up Expiration Round

Expected Lock-up Expiration Time (ET)

Estimated Unlocked Shares

Percentage of Total Share Capital

Round 1 (First Wave)

August 6, 2026

Approx. 911 million – 920 million shares

Approx. 7.0%

Round 2 (Phased Unlock Period)

August – Mid-October 2026

Approx. 960 million shares

Approx. 7.3%

Round 3

Late October / Early November 2026

Approx. 1.28 billion – 1.30 billion shares

Approx. 9.8%

Round 4

December 8, 2026

Approx. 1.15 billion – 1.20 billion shares

Approx. 8.8%

Disclaimer: For information purposes only. Past performance is not indicative of future results.
placeholder
Will the Tech Rally Continue? The Technical Verdict on the NASDAQ 100 Riding a massive 32% post-earnings wave, the Nasdaq-100 is showing its first signs of exhaustion. We break down crucial exit and entry rules for long positions this week.
Author  Mitrade Team
Jun 05, Fri
Riding a massive 32% post-earnings wave, the Nasdaq-100 is showing its first signs of exhaustion. We break down crucial exit and entry rules for long positions this week.
placeholder
XRP Price Prediction for July 2026: Can Buyers Finally Break the Downtrend?XRP (XRP) price trades near $1.05, caught between a year-long downtrend and a sudden burst of buying.July has historically rewarded XRP holders. This year the month arrives with on-chain accumulation
Author  Beincrypto
Jun 30, Tue
XRP (XRP) price trades near $1.05, caught between a year-long downtrend and a sudden burst of buying.July has historically rewarded XRP holders. This year the month arrives with on-chain accumulation
placeholder
What to Expect From Ethereum (ETH) in July 2026Ethereum (ETH) enters July 2026 trading near $1,570, close to multi-month lows, after recording its first run of three consecutive red quarterly candles in its history.On-chain data and price charts n
Author  Beincrypto
Jul 01, Wed
Ethereum (ETH) enters July 2026 trading near $1,570, close to multi-month lows, after recording its first run of three consecutive red quarterly candles in its history.On-chain data and price charts n
placeholder
Intel Price Forecast: Nvidia Picked Xeon 6, Invested $5B, Yet Analysts Still Trail INTCIntel Corporation (NASDAQ: INTC) sits at $140.05, holding firm on the ascending trendline within the 2H timeframe. The RSI indicator is currently reading 55.21, positioning it as neutral-
Author  TradingKey
Jul 02, Thu
Intel Corporation (NASDAQ: INTC) sits at $140.05, holding firm on the ascending trendline within the 2H timeframe. The RSI indicator is currently reading 55.21, positioning it as neutral-
placeholder
NVIDIA Price Forecast: Michael Burry Shorts NVDA, but Analysts See $299On July 1, NVIDIA (NASDAQ: NVDA) sits at $198.34, failing to break above the former support level that is now serving as resistance between $198 and $205 on the 2H chart's downward blue c
Author  TradingKey
Jul 02, Thu
On July 1, NVIDIA (NASDAQ: NVDA) sits at $198.34, failing to break above the former support level that is now serving as resistance between $198 and $205 on the 2H chart's downward blue c
goTop
quote