


Google Stock Price Prediction: Server AI Accelerator Shipments Expected to Catch Up With Nvidia by 2028; Can Stock Price Return to $400?
TradingKey - On August 3, Eastern Time, Google ( GOOGL) shares rose over 5%, returning to $375 and breaking through a recent high.
According to media reports, a market analysis report states that Google plans to deploy 12 to 15 million of its proprietary TPU v9 AI ASIC chips by 2028. Given that analysis suggests Nvidia ( NVDA )'s 2028 AI GPU shipments could reach 12.4 million units, this means Google's server AI accelerator shipment volume is expected to catch up with or even exceed Nvidia's by the year after next.
Meanwhile, Google DeepMind recently officially launched Gemini Robotics 2, its next-generation robotic AI model. This breakthrough equips humanoid robots with head-to-toe full-body movement coordination, marking a critical step forward for the tech giant in the race to extend AI capabilities into the physical world.
The biggest technical highlight of Gemini Robotics 2 is that its control over humanoid robots has expanded from the previously limited upper body to complete, full-body control. This means that while performing complex reasoning tasks, robots can simultaneously execute high-difficulty movements such as walking, squatting, and agilely manipulating objects.
In a recent demonstration to the media, the model successfully controlled Apptronik's Apollo humanoid robot, completing a full workflow of autonomously bypassing obstacles, walking across a room, precisely picking up a watering can, and placing it on a low shelf, demonstrating a high degree of autonomous coordination.
In addition, the partnership between Google and Oracle has been upgraded once again, directly integrating its flagship AI model, Gemini, into Oracle's enterprise software ecosystem.
Under the agreement, Google's Gemini model will be integrated into Oracle's AI Agent Studio (for Fusion Applications), enabling enterprise customers to build, customize, and deploy autonomous AI agents. Oracle also plans to natively embed Gemini into its flagship Fusion Cloud Applications and Oracle NetSuite.
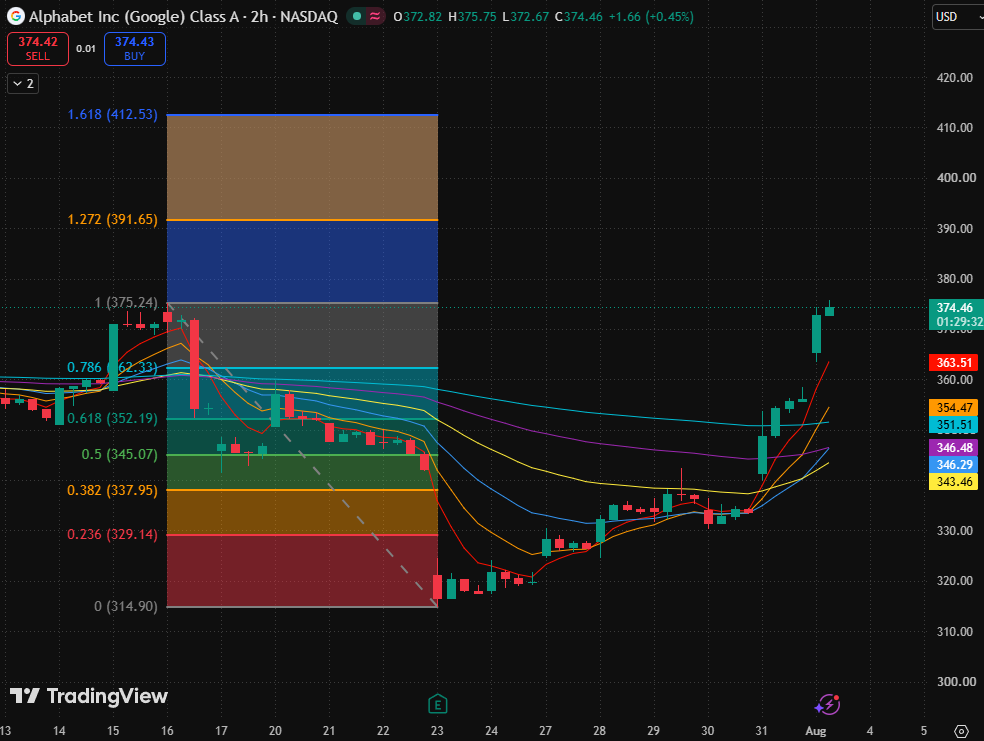
Google 2-Hour Stock Chart, Source: TradingView
Looking at Google's candlestick chart, the current stock price has accelerated significantly since rebounding from its recent low of $314.9, consecutively breaking through multiple short- and medium-term moving averages, and reclaiming the vicinity of its previous key high of $375.24. With the current price closing in on this prior high, the trend has shifted from a corrective rebound to an upward confirmation phase, with short-term bulls in control.
From a Fibonacci perspective, Google has successively reclaimed several resistance levels ($329.14, $337.95, $345.07, and $352.19) and tested its prior high of $375.24, indicating that the recovery from the previous retracement is well underway.
In terms of upside potential, the first key level is whether the stock price can effectively break through the recent high ($375.24); if it successfully consolidates above this level, the upside will open toward the 1.272 Fibonacci extension level ($391.65), and further toward the 1.618 extension level ($412.53).
If the stock price fails to hold after pushing higher and falls back below $363.51, it will seek support lower. A further retracement target would be $352.19. A break below $345.07 would suggest that the momentum of this breakout has significantly weakened, and the trend should be reassessed.
Recommended Articles


