

US July PPI Below Expectations as Producer Inflation Cools Significantly, Easing Fed Rate Hike Pressure

Source Tradingkey

TradingKey - Data released by the U.S. Bureau of Labor Statistics on Thursday showed that the U.S. Producer Price Index (PPI) for July was flat month-over-month, lower than market expectations of a 0.2% increase; year-over-year, it rose 4.7%, pulling back significantly from 5.5% in June and coming in below market expectations of 4.9%, indicating that production-side inflationary pressures in the U.S. are cooling down.

Core PPI, which excludes food and energy, rose 0.2% month-over-month, below market expectations of 0.3%; year-over-year, it rose 4.2%, declining further from the previous reading of 4.7%. The U.S. July CPI released a day earlier also slowed from 3.5% to 3.4% year-over-year, with two consecutive inflation reports both showing a moderation in price pressures.

Looking at specific components, final demand goods prices fell 0.7% in July, with energy prices dropping 3.1% and food prices declining 0.9%; gasoline prices fell 5.7%, becoming a major factor behind the pullback in goods prices. Meanwhile, final demand services prices rose 0.2% and construction prices rose 2.2%, partially offsetting the decline in goods prices.

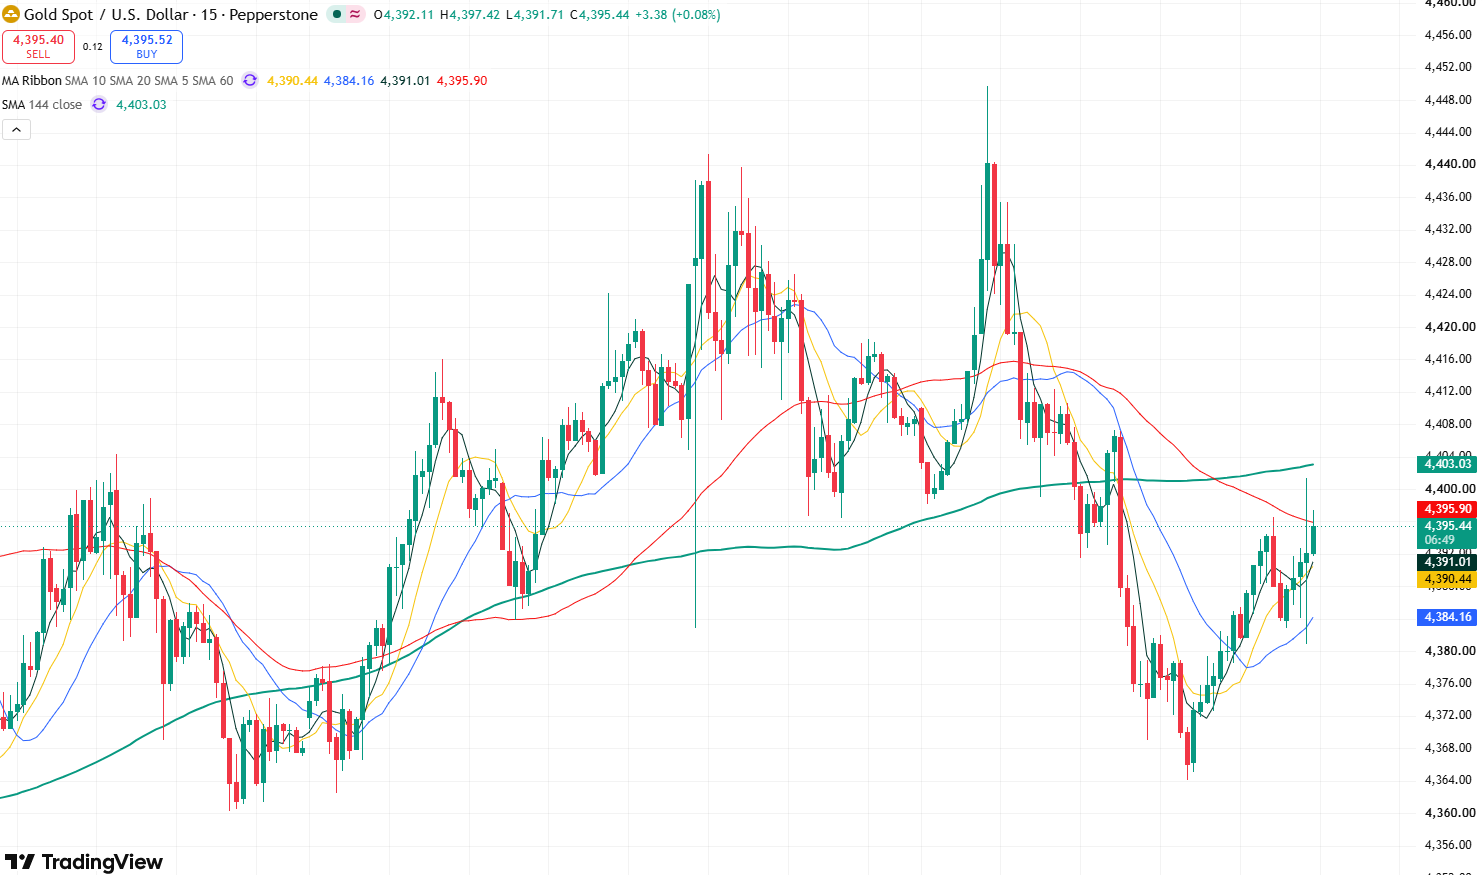
Following the data release, gold rallied on the positive news, with prices quickly advancing toward the $4,400 mark. The lower-than-expected PPI further relieved market concerns about a reacceleration of U.S. inflation and reduced pressure on the Federal Reserve to continue raising interest rates in the short term.
gold-584cbb64ba3145e1ac4b2eca676ed688

Gold Price 15-Minute Chart, Source: TradingView

For the market, the July PPI together with the previous CPI sent signals of cooling inflation. Against the backdrop of a noticeable recent slowdown in the U.S. labor market, declining inflationary pressure means the Federal Reserve has greater policy leeway between economic growth and prices. Moving forward, investors will continue to monitor statements from Fed officials and subsequent PCE inflation data to gauge the policy direction for the September rate-setting meeting.

Disclaimer: For information purposes only. Past performance is not indicative of future results.
placeholder
Will the Tech Rally Continue? The Technical Verdict on the NASDAQ 100 Riding a massive 32% post-earnings wave, the Nasdaq-100 is showing its first signs of exhaustion. We break down crucial exit and entry rules for long positions this week.
Author  Mitrade Team
Jun 05, Fri
Riding a massive 32% post-earnings wave, the Nasdaq-100 is showing its first signs of exhaustion. We break down crucial exit and entry rules for long positions this week.
placeholder
XRP Price Prediction for July 2026: Can Buyers Finally Break the Downtrend?XRP (XRP) price trades near $1.05, caught between a year-long downtrend and a sudden burst of buying.July has historically rewarded XRP holders. This year the month arrives with on-chain accumulation
Author  Beincrypto
Jun 30, Tue
XRP (XRP) price trades near $1.05, caught between a year-long downtrend and a sudden burst of buying.July has historically rewarded XRP holders. This year the month arrives with on-chain accumulation
placeholder
What to Expect From Ethereum (ETH) in July 2026Ethereum (ETH) enters July 2026 trading near $1,570, close to multi-month lows, after recording its first run of three consecutive red quarterly candles in its history.On-chain data and price charts n
Author  Beincrypto
Jul 01, Wed
Ethereum (ETH) enters July 2026 trading near $1,570, close to multi-month lows, after recording its first run of three consecutive red quarterly candles in its history.On-chain data and price charts n
placeholder
Intel Price Forecast: Nvidia Picked Xeon 6, Invested $5B, Yet Analysts Still Trail INTCIntel Corporation (NASDAQ: INTC) sits at $140.05, holding firm on the ascending trendline within the 2H timeframe. The RSI indicator is currently reading 55.21, positioning it as neutral-
Author  TradingKey
Jul 02, Thu
Intel Corporation (NASDAQ: INTC) sits at $140.05, holding firm on the ascending trendline within the 2H timeframe. The RSI indicator is currently reading 55.21, positioning it as neutral-
placeholder
XAUUSD Gold Analysis: Gold Holds Above $4,350 Ahead of US Inflation Data Is $4,500 Next? Gold holds above $4,350 following weak US jobs data. As inflation reports approach and UBS eyes $5,000, can XAUUSD break resistance at $4,435 to rally toward $4,500?
Author  Naoufal Seddik
Yesterday 02: 34
Gold holds above $4,350 following weak US jobs data. As inflation reports approach and UBS eyes $5,000, can XAUUSD break resistance at $4,435 to rally toward $4,500?
goTop
quote