


Ripple Price Forecast: XRP tests lower support range amid capitulation, bearish sentiment
- XRP hovers around $1.32 on Friday as buyers struggle to sustain gains in a broader bearish crypto market.
- XRP Net Unrealized Profit/Loss on-chain indicator signals continued capitulation and a potential bottom formation.
- Mild inflows into spot ETFs support a short-term recovery outlook, but weak momentum indicators may cap any bullish move.
Ripple (XRP) is gaining mild traction, trading around $1.32 at the time of writing on Friday, as the crypto prices broadly stabilize. Despite the slight price increase, sentiment across the market remains significantly suppressed, as investors assess the conflict in the Middle East, which continues to put a chokehold on global Oil and Gas supplies.
The United States (US) and Iran are reported to have finalized the Memorandum of Understanding (MOU), which could set the stage for a 60-day ceasefire, open the Strait of Hormuz and pave the way for nuclear talks. However, US President Donald Trump has yet to give his approval, while a report by Tasnim, Iran’s semi-official news agency, indicates that the MOU's text has neither been finalized nor confirmed.
Trump said on Wednesday that he will not be rushed into making a deal, suggesting that despite the negotiations, a peace agreement may not be imminent.
XRP holders face capitulation as recovery outlook weakens
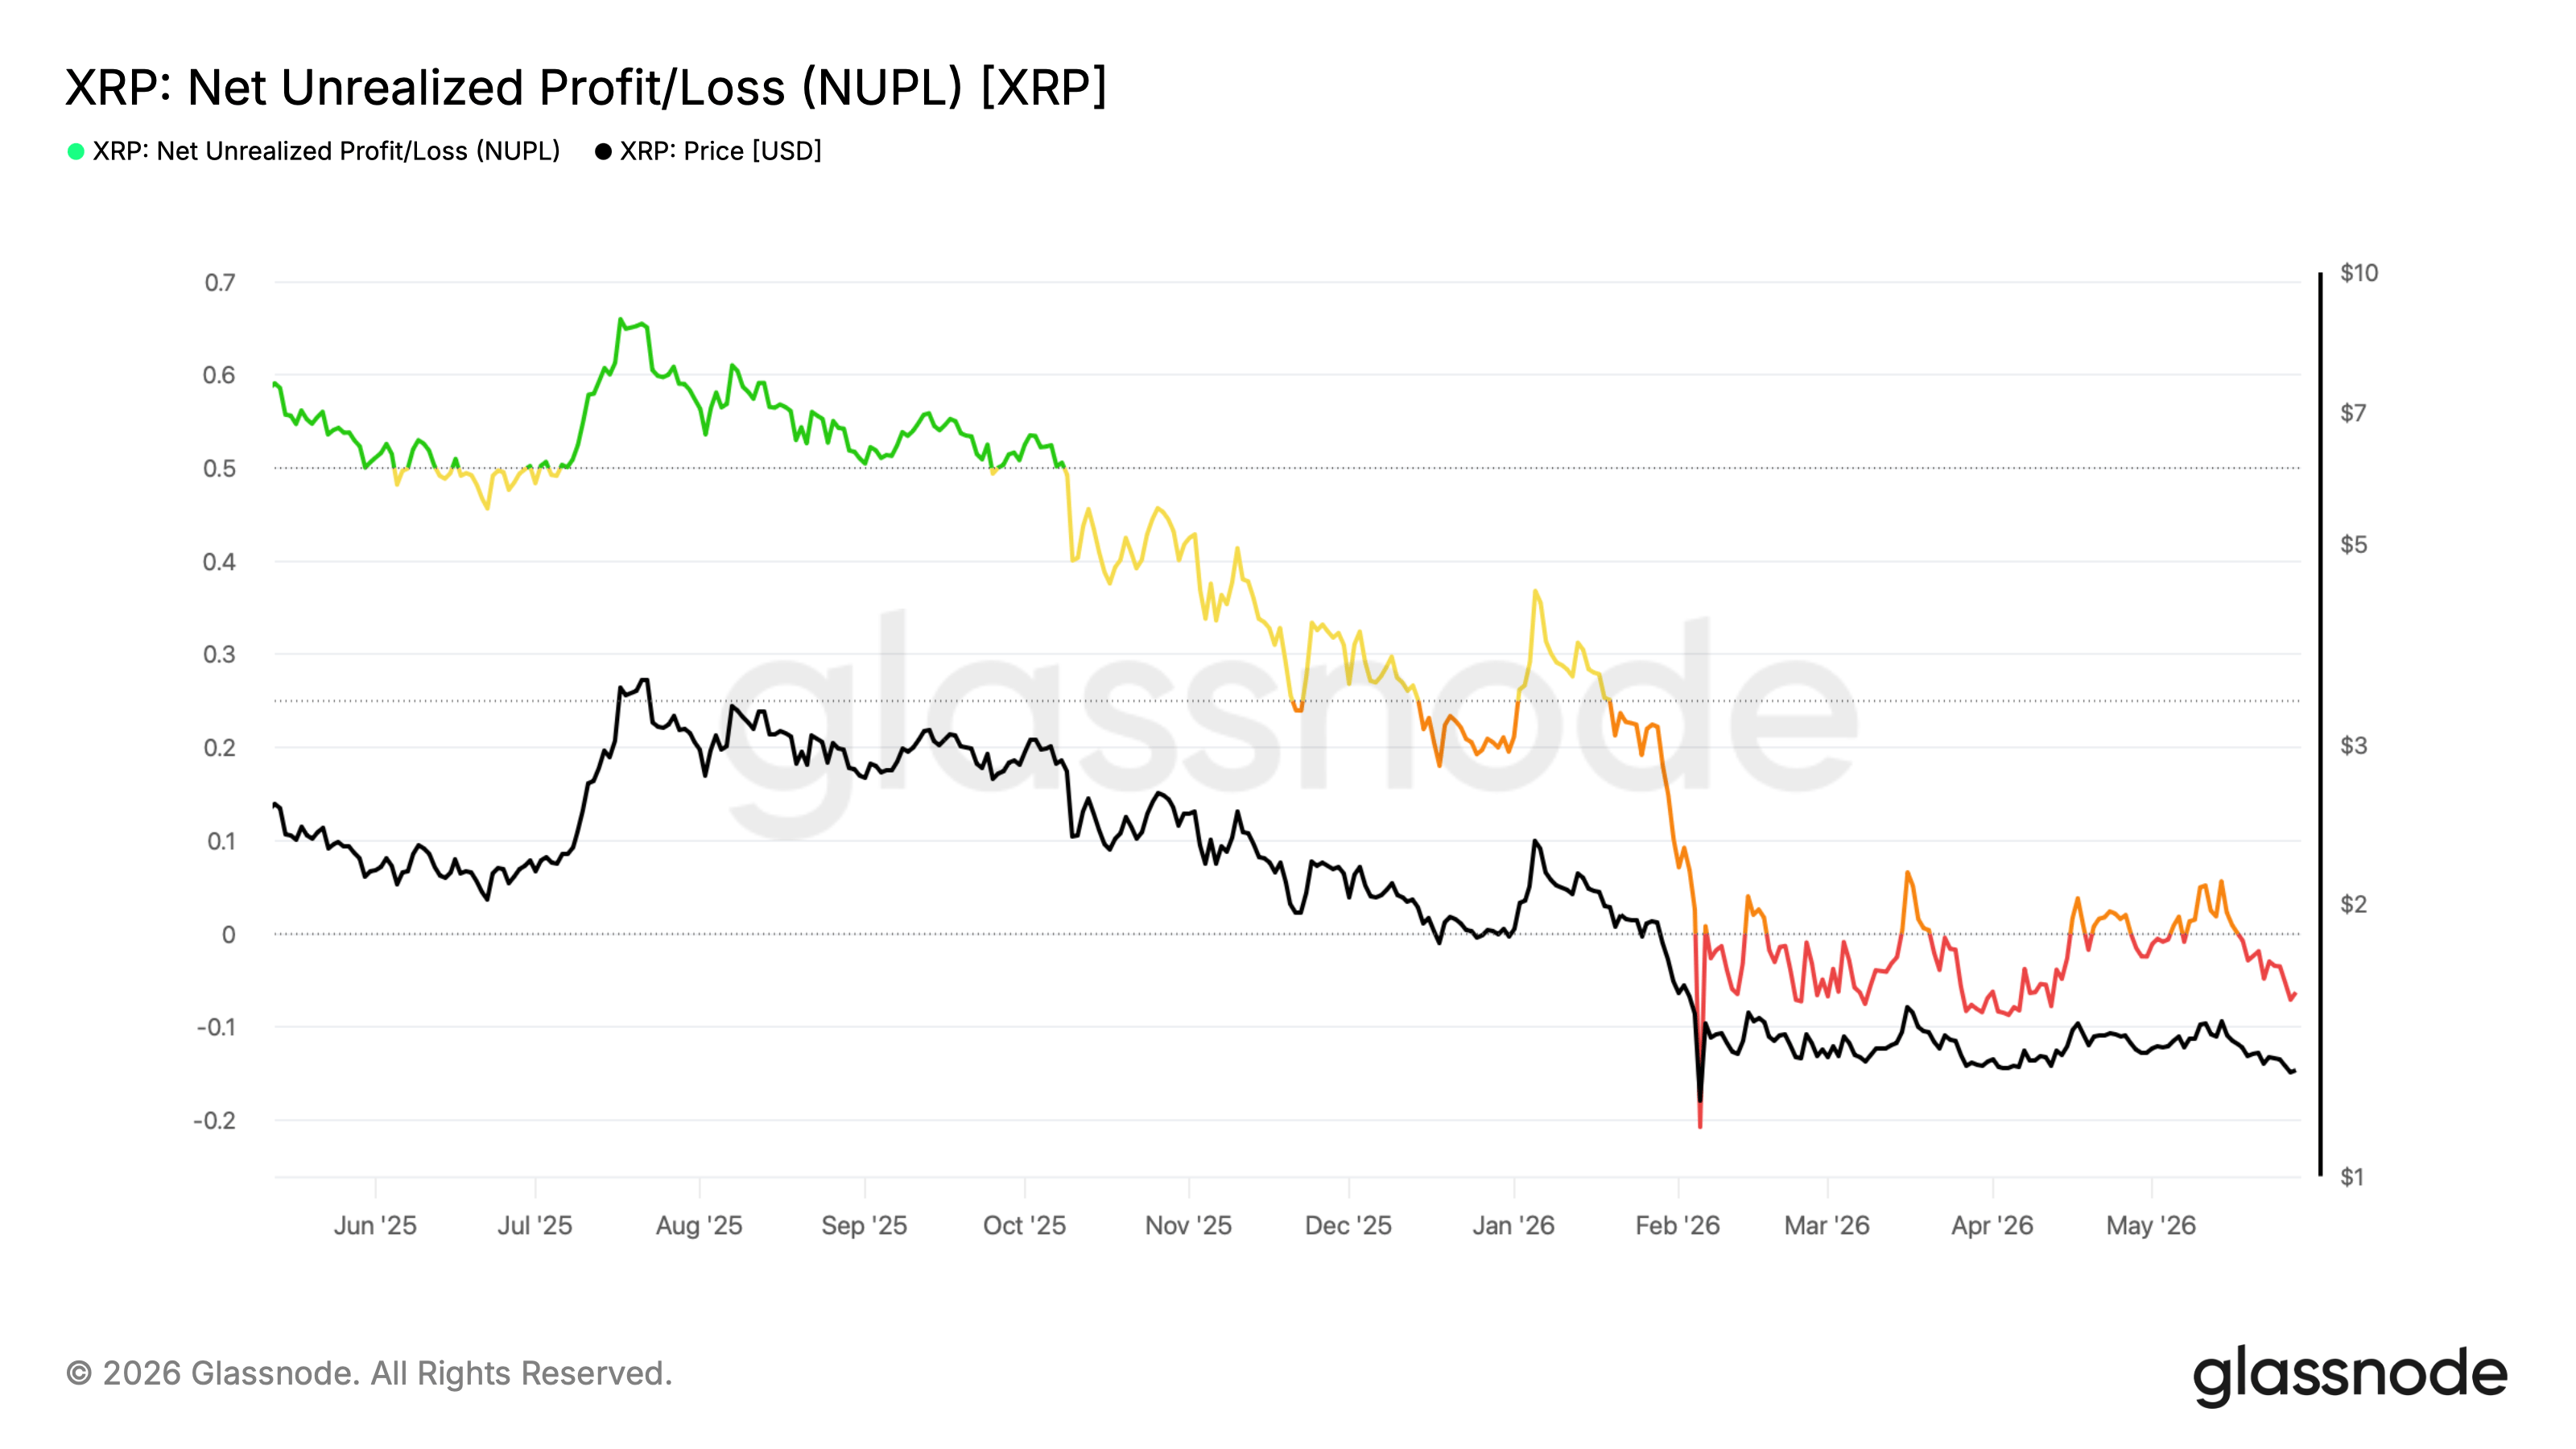
The XRP Net Unrealized Profit/Loss (NUPL), a metric that shows the difference between the relative unrealized profit and relative unrealized loss of the cross-border remittance token, slipped further into negative territory at -0.06 on Thursday, according to Glassnode.
When NUPL is negative, it indicates that more investors are experiencing unrealized losses. On one hand, this signals continued capitulation, weighed down by bearish sentiment and on the other, suggests that a market bottom is in formation.
Traders should watch for the NUPL to cross above the zero line, signaling a shift from losses to profits and growing optimism about a market bottom. For now, uncertainty and unrealized losses continue to dominate, further weighing on sentiment.
XRP spot Exchange-Traded Funds (ETFs), on the other hand, have sustained a relatively steady bullish streak with mild inflows of $1.77 million on Thursday. It is worth mentioning that activity remained muted on Wednesday. Before that, the ETFs had upheld a steady, mild but bullish streak since May 14. Cumulative inflows now stand at $1.41 billion with net assets under management at $1.12 billion.
Although suppressed inflows could be supportive of XRP’s short-term outlook, the broader crypto market remains lethargic, with structural weakness capping the tone. XRP may experience a slow recovery.
Price analysis: XRP holds key support
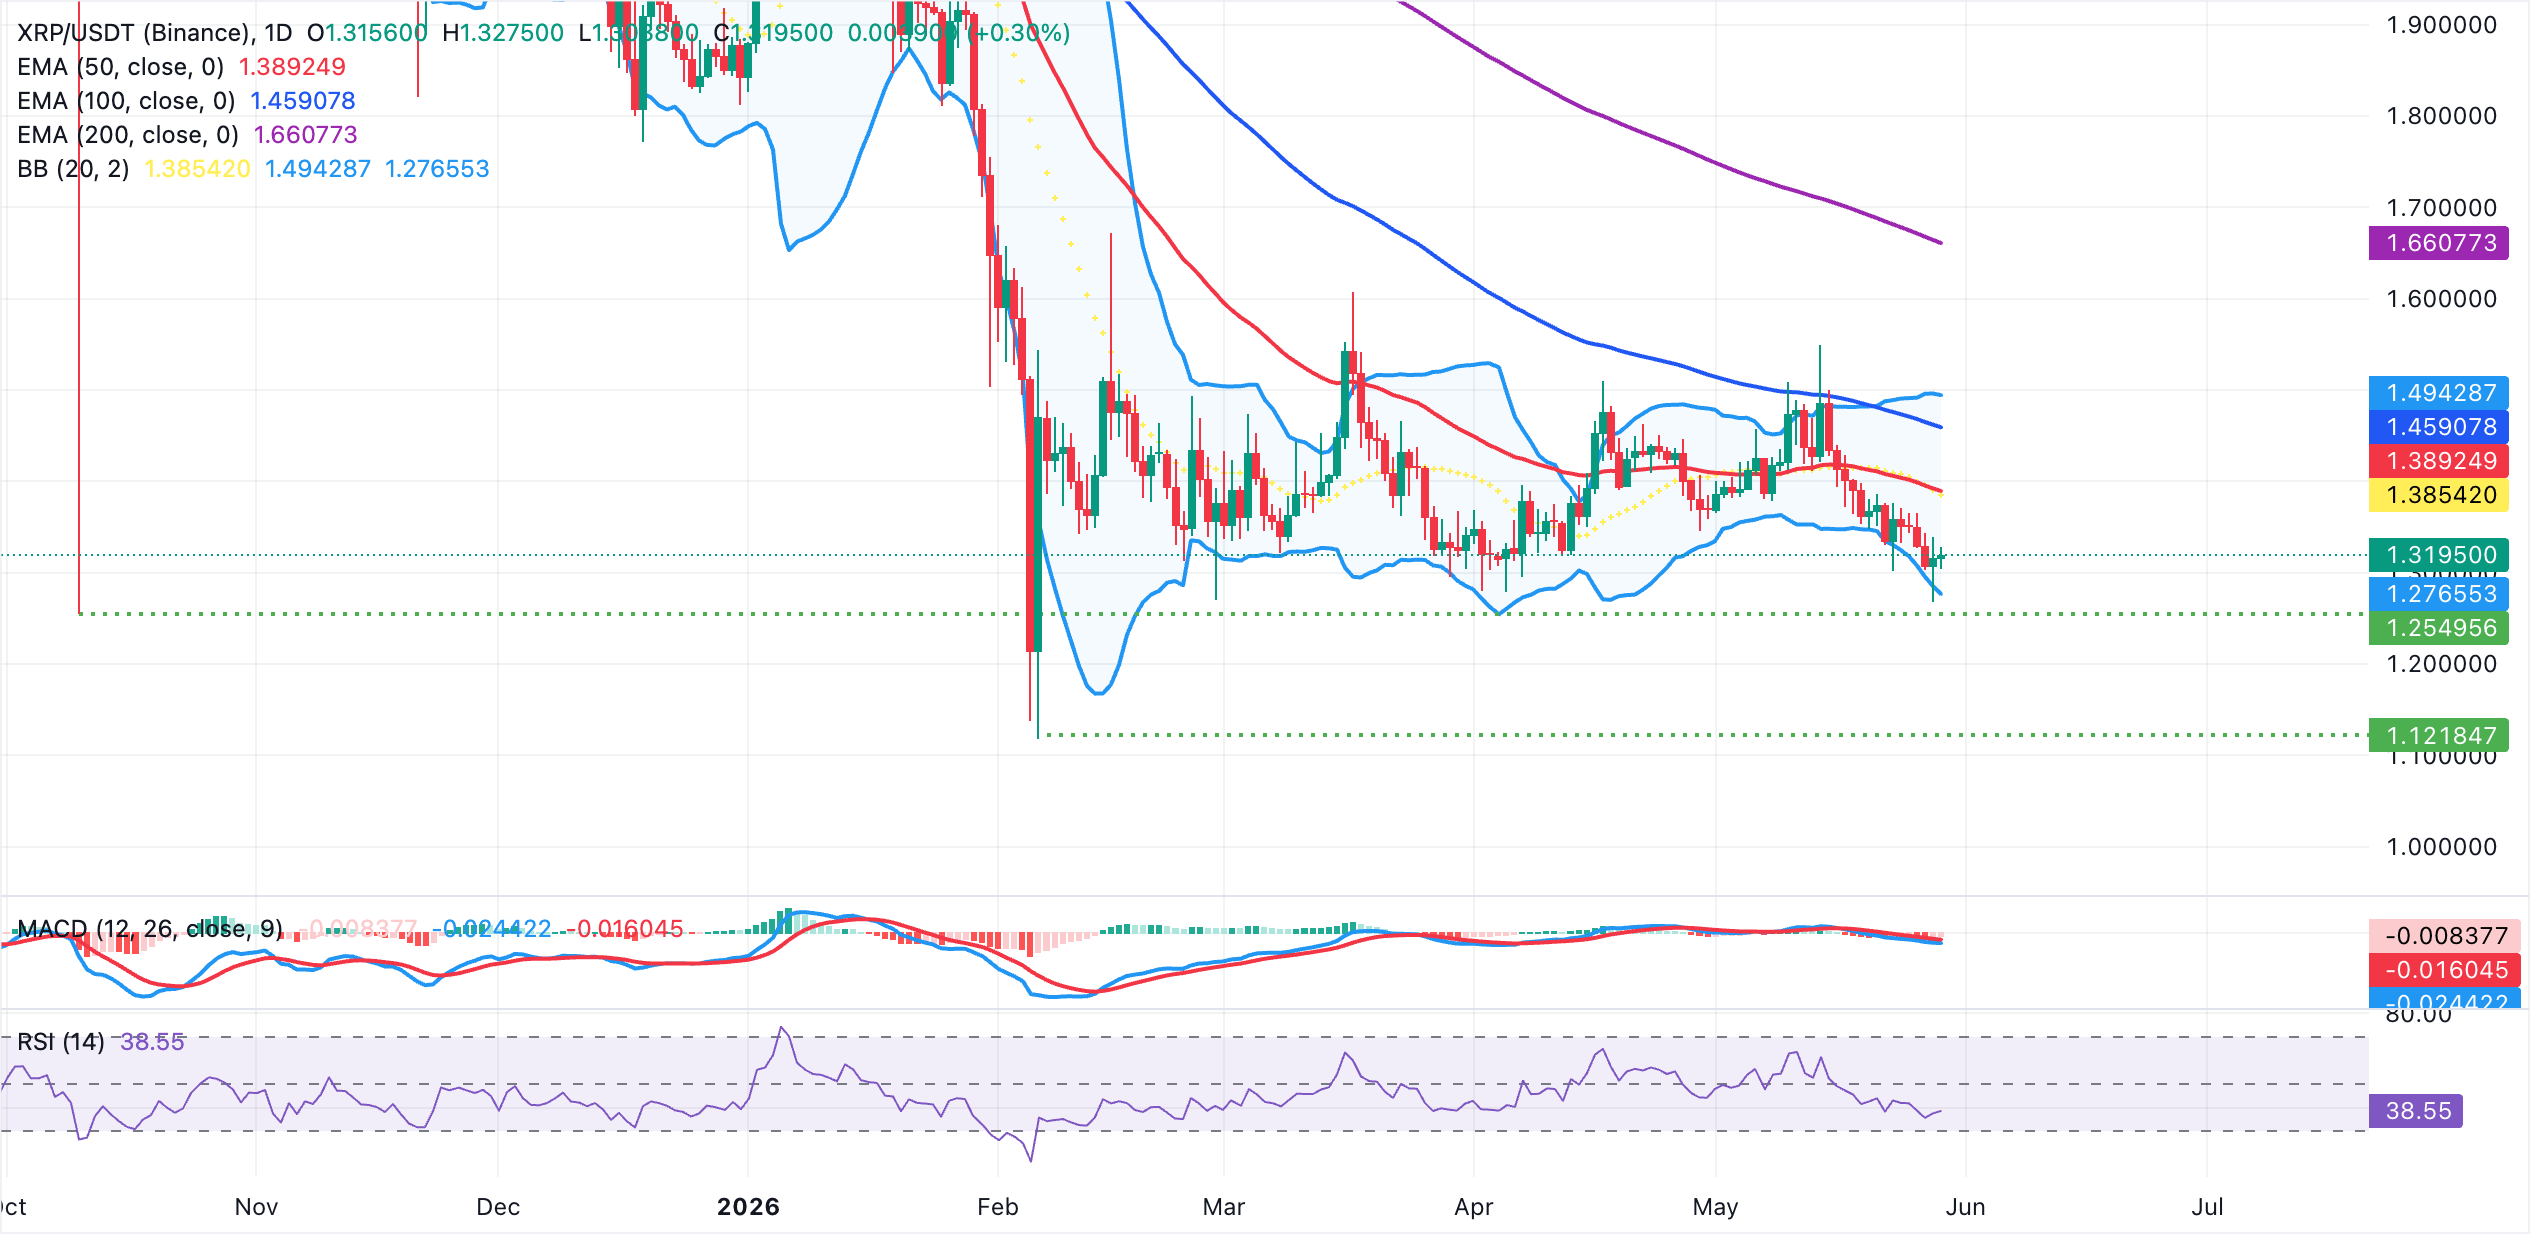
XRP trades around $1.32 as the pair remains under a clear bearish bias. The token holds below the Bollinger middle band around $1.39, which coincides with the 50-day Exponential Moving Average (EMA), keeping the broader structure capped.
At the same time, momentum also leans to the downside, with the Relative Strength Index (RSI) hovering around 39 on the daily chart and the Moving Average Convergence Divergence (MACD) histogram in negative territory, which together suggest persistent selling pressure despite the recent stabilization.
On the topside, initial resistance lies in the $1.38-$1.39 area where the Bollinger middle band and the 50-day EMA cluster, followed by the 100-day EMA near $1.46 and the Bollinger upper band around $1.49, while the 200-day EMA higher up at $1.66 marks a more substantial medium-term barrier. On the downside, immediate support is aligned with the Bollinger lower band near $1.28. A clear break below this floor would likely open the door to extended losses as the bearish bias extends.
(The technical analysis of this story was written with the help of an AI tool.)
Ripple FAQs
Ripple is a payments company that specializes in cross-border remittance. The company does this by leveraging blockchain technology. RippleNet is a network used for payments transfer created by Ripple Labs Inc. and is open to financial institutions worldwide. The company also leverages the XRP token.
XRP is the native token of the decentralized blockchain XRPLedger. The token is used by Ripple Labs to facilitate transactions on the XRPLedger, helping financial institutions transfer value in a borderless manner. XRP therefore facilitates trustless and instant payments on the XRPLedger chain, helping financial firms save on the cost of transacting worldwide.
XRPLedger is based on a distributed ledger technology and the blockchain using XRP to power transactions. The ledger is different from other blockchains as it has a built-in inflammatory protocol that helps fight spam and distributed denial-of-service (DDOS) attacks. The XRPL is maintained by a peer-to-peer network known as the global XRP Ledger community.
XRP uses the interledger standard. This is a blockchain protocol that aids payments across different networks. For instance, XRP’s blockchain can connect the ledgers of two or more banks. This effectively removes intermediaries and the need for centralization in the system. XRP acts as the native token of the XRPLedger blockchain engineered by Jed McCaleb, Arthur Britto and David Schwartz.
Recommended Articles


