

NEAR Protocol Price Forecast: Corrective phase develops as ETF flows signal weakening demand

Source Fxstreet
  • NEAR Protocol falls 5% on Thursday, erasing most of the previous day's 6% surge.
  • Mixed NEAR-focused ETF flows this week suggest weaker buying pressure.
  • NEAR's technical outlook points to a corrective phase within the broader uptrend as upside momentum fades.

NEAR Protocol (NEAR) is down 5% at press time on Thursday, trading below $5.00 and wiping out most of the previous day's 6% recovery. NEAR-focused Exchange-Traded Fund (ETF) shows mixed flows this week, suggesting weaker buying pressure after three consecutive weeks of inflows. The technical outlook for NEAR is mixed as a corrective phase develops within a broader uptrend amid fading upside momentum.

Institutional appetite eases

Bitwise’s NEAR-focused ETF (NRR) is facing mixed inflows this week, suggesting flickering demand from institutional investors. SoSoValue data shows NRR recorded $830,700 in inflows on Wednesday, recovering from its first-ever day of selling, with $2.54 million in outflows on Tuesday.

The ETF also maintains a streak of three straight weekly inflows and has recorded $3.71 million so far this week, including the $5.42 million inflow on Monday. A positive close to the week could ease the fears of institutional investors backing out.
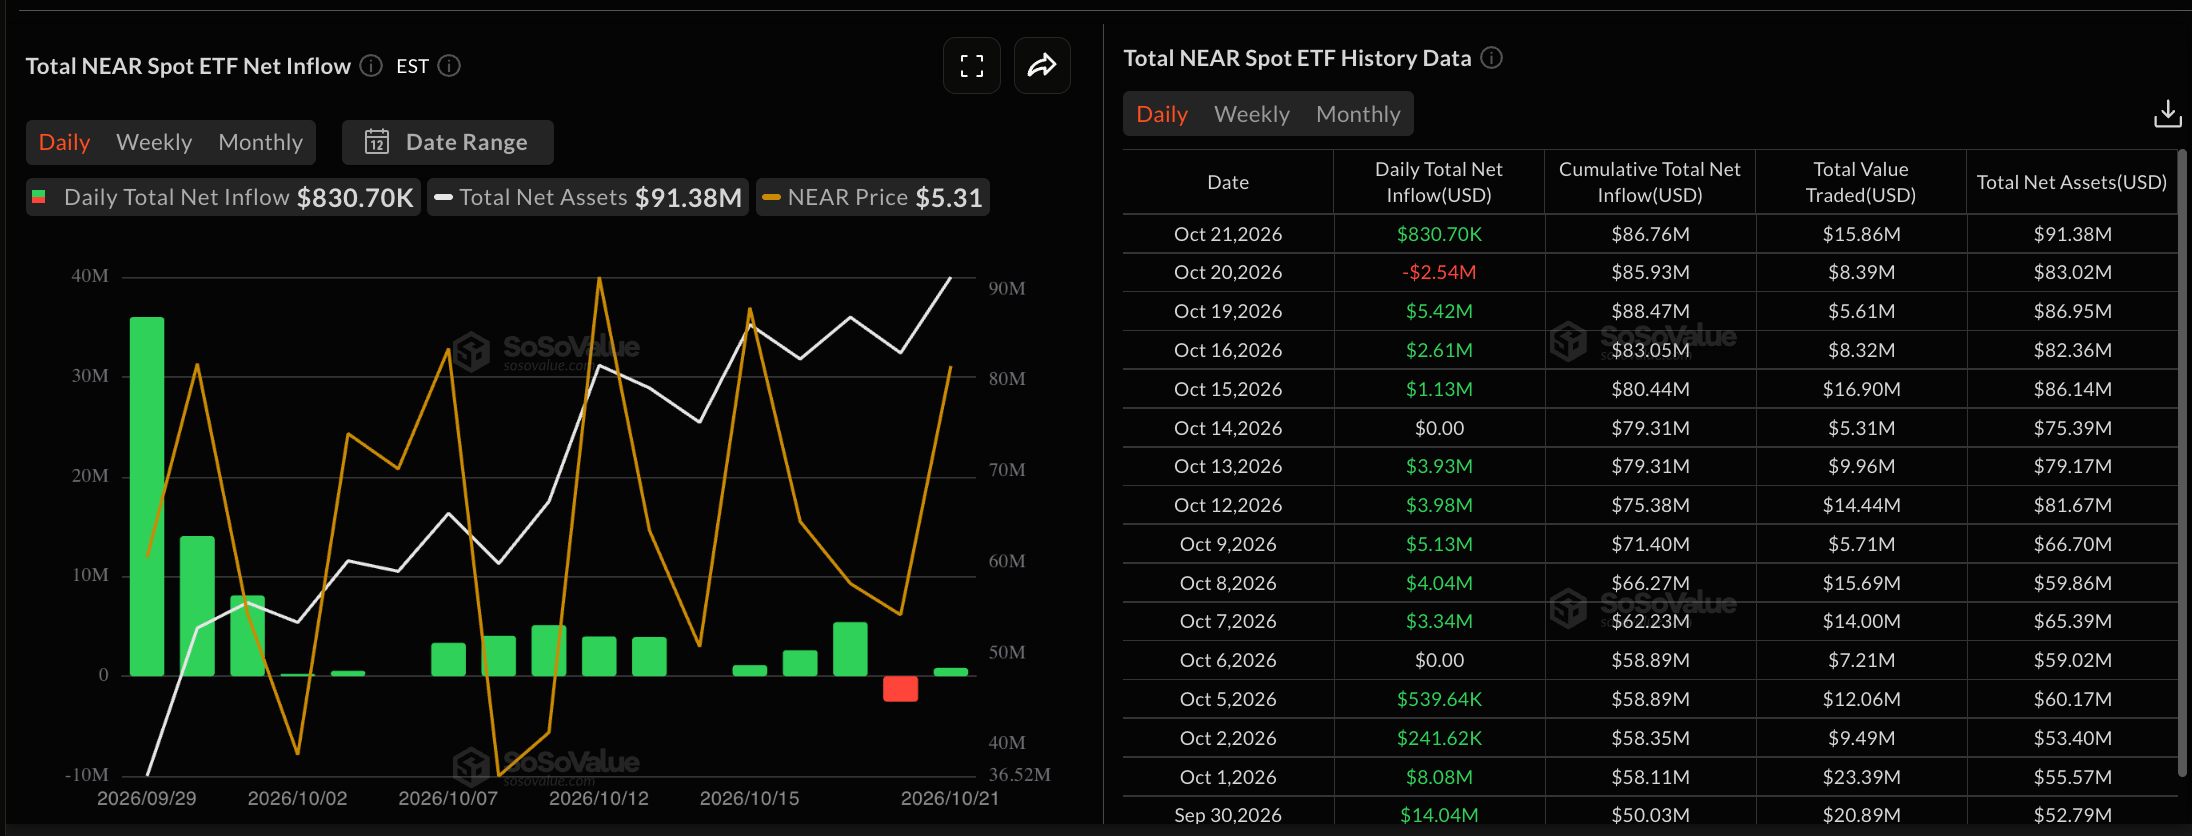
NEAR ETFs data. Source: Sosovalue

On the retail side, the NEAR futures Open Interest (OI) has increased to $1.67 billion on Thursday, up from $1.47 billion on Monday, suggesting a positional buildup this week. Typically, a steady rise in OI indicates a renewed appeal for NEAR among traders.
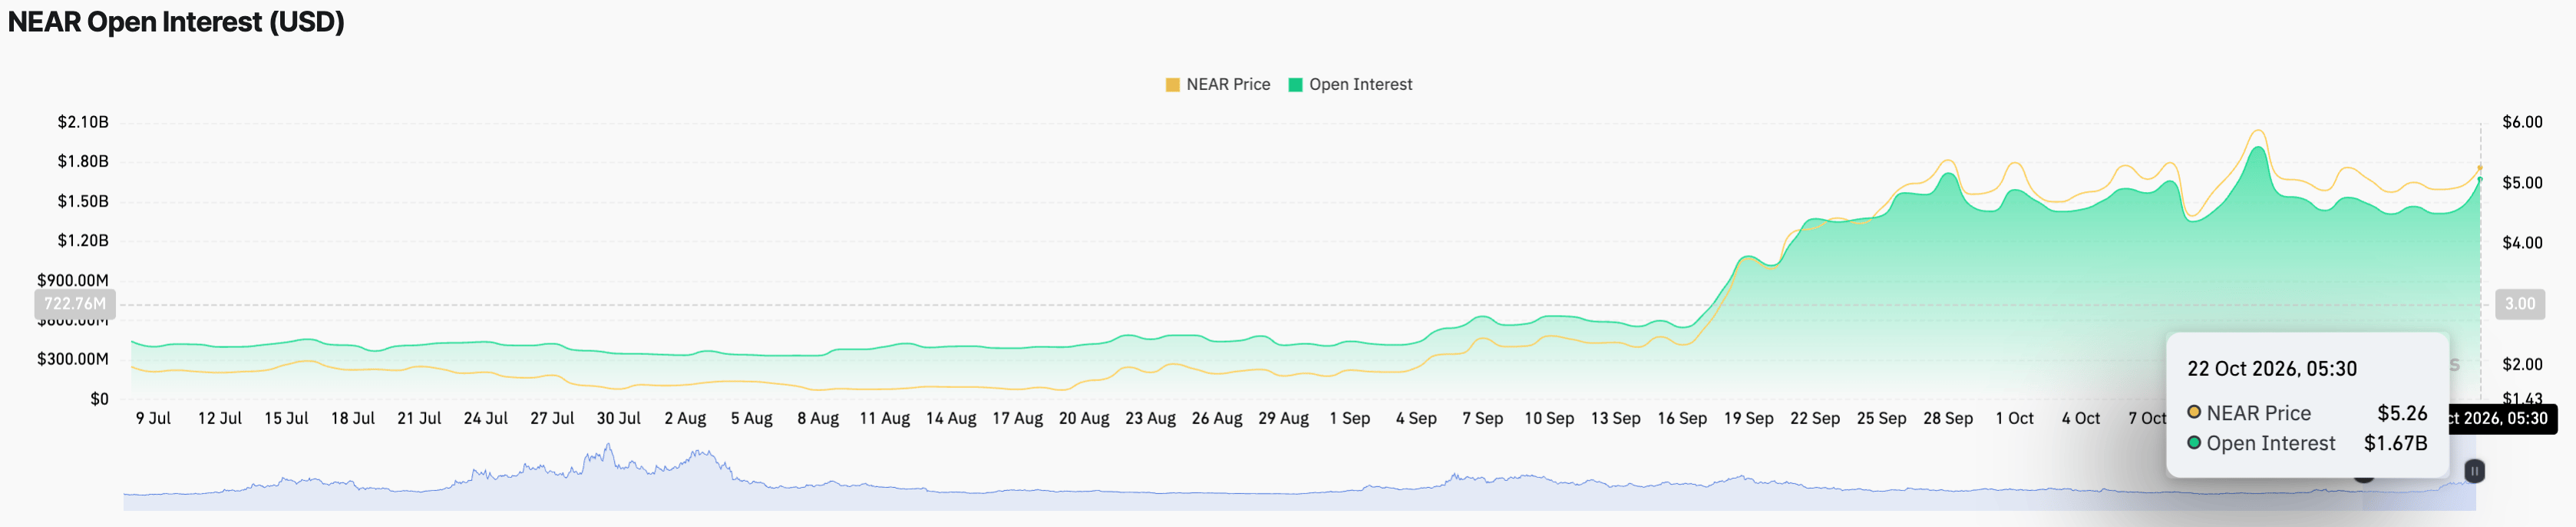
NEAR Open Interest data. Source: CoinGlass

Technical outlook: NEAR gains momentum on a pullback

NEAR trades at $4.99 at press time on Thursday, holding in a neutral but slightly capped stance. On the four-hour chart, the price sits below the 50-period Exponential Moving Average (EMA) at $5.03 but remains comfortably above the 200-period EMA at $4.61, suggesting consolidation within the broader uptrend.

Looking down, the rising support trendline near $4.70 underpins bullish strength at lower levels, reinforced by the 200-period EMA and the September 25 low at $4.44. A confirmed breakout below $4.44 could nullify the near-term support cluster, risking a steeper decline toward the $$3.91 support level set by the September 19 high.

The Moving Average Convergence Divergence (MACD) and signal line risk a bearish crossover on the four-hour chart, while the Relative Strength Index (RSI) hovers at 47, below the midline, hinting at fading bullish momentum.

To reinstate an upward trend, NEAR price must surpass the $5.44 resistance set by the October 15 high, which capped gains on Wednesday and resulted in a 5% decline so far today. This could open the path toward the October 12 high at $6.00.

Chart Analysis NEAR/USDT (Binance)
NEAR/USDT daily price chart.

(The technical analysis of this story was written with the help of an AI tool. Know more.)

Disclaimer: For information purposes only. Past performance is not indicative of future results.
placeholder
XRP Price Prediction for July 2026: Can Buyers Finally Break the Downtrend?XRP (XRP) price trades near $1.05, caught between a year-long downtrend and a sudden burst of buying.July has historically rewarded XRP holders. This year the month arrives with on-chain accumulation
Author  Beincrypto
Jun 30, Tue
XRP (XRP) price trades near $1.05, caught between a year-long downtrend and a sudden burst of buying.July has historically rewarded XRP holders. This year the month arrives with on-chain accumulation
placeholder
XAUUSD Gold Analysis: Gold Holds Above $4,350 Ahead of US Inflation Data Is $4,500 Next? Gold holds above $4,350 following weak US jobs data. As inflation reports approach and UBS eyes $5,000, can XAUUSD break resistance at $4,435 to rally toward $4,500?
Author  Naoufal Seddik
Aug 12, Wed
Gold holds above $4,350 following weak US jobs data. As inflation reports approach and UBS eyes $5,000, can XAUUSD break resistance at $4,435 to rally toward $4,500?
placeholder
Gold Price Analysis Today: Gold Drops 1.32% Despite Lower Fed Rate-Hike Bets, Can $4,313 Support Hold? Gold fell 1.32% on August 13 after rising to $4,449.73, then reversing lower and closing near $4,349.918 below the $4,356.46 support. Softer US inflation data reduced Fed rate hike expectations, but selling pressure still dominated the session. Will $4,313 support hold?
Author  Naoufal Seddik
Aug 14, Fri
Gold fell 1.32% on August 13 after rising to $4,449.73, then reversing lower and closing near $4,349.918 below the $4,356.46 support. Softer US inflation data reduced Fed rate hike expectations, but selling pressure still dominated the session. Will $4,313 support hold?
placeholder
Gold Price Analysis Today: Gold Gains 0.94% as Markets Expect Fed to Hold Rates, Can $4,449 Resistance Break? Gold gained 0.94% on August 17, closing near $4,417.30 as softer US data strengthened expectations for unchanged Fed rates in September. Gold remains bullish, with $4,449.730 resistance and $4,310.650 support in focus.
Author  Naoufal Seddik
Aug 18, Tue
Gold gained 0.94% on August 17, closing near $4,417.30 as softer US data strengthened expectations for unchanged Fed rates in September. Gold remains bullish, with $4,449.730 resistance and $4,310.650 support in focus.
placeholder
3 Stocks That Can Benefit From SpaceX’s Surprise Q3 EarningsSpaceX’s latest earnings have given Wall Street a reason to revisit AI hardware stocks. Elon Musk’s company is preparing to spend billions more on computing infrastructure, and three US-listed stocks
Author  Beincrypto
Yesterday 01: 20
SpaceX’s latest earnings have given Wall Street a reason to revisit AI hardware stocks. Elon Musk’s company is preparing to spend billions more on computing infrastructure, and three US-listed stocks
goTop
quote