Solana Price Forecast: SOL risks $100 breakdown as ETF outflows mount

Source Fxstreet
  • Solana extends losses on Thursday after retreating over 2% from its 50-day EMA at $107.13 the previous day.
  • SOL-focused ETFs recorded over $1 million in redemptions, marking their eighth consecutive day of outflows.
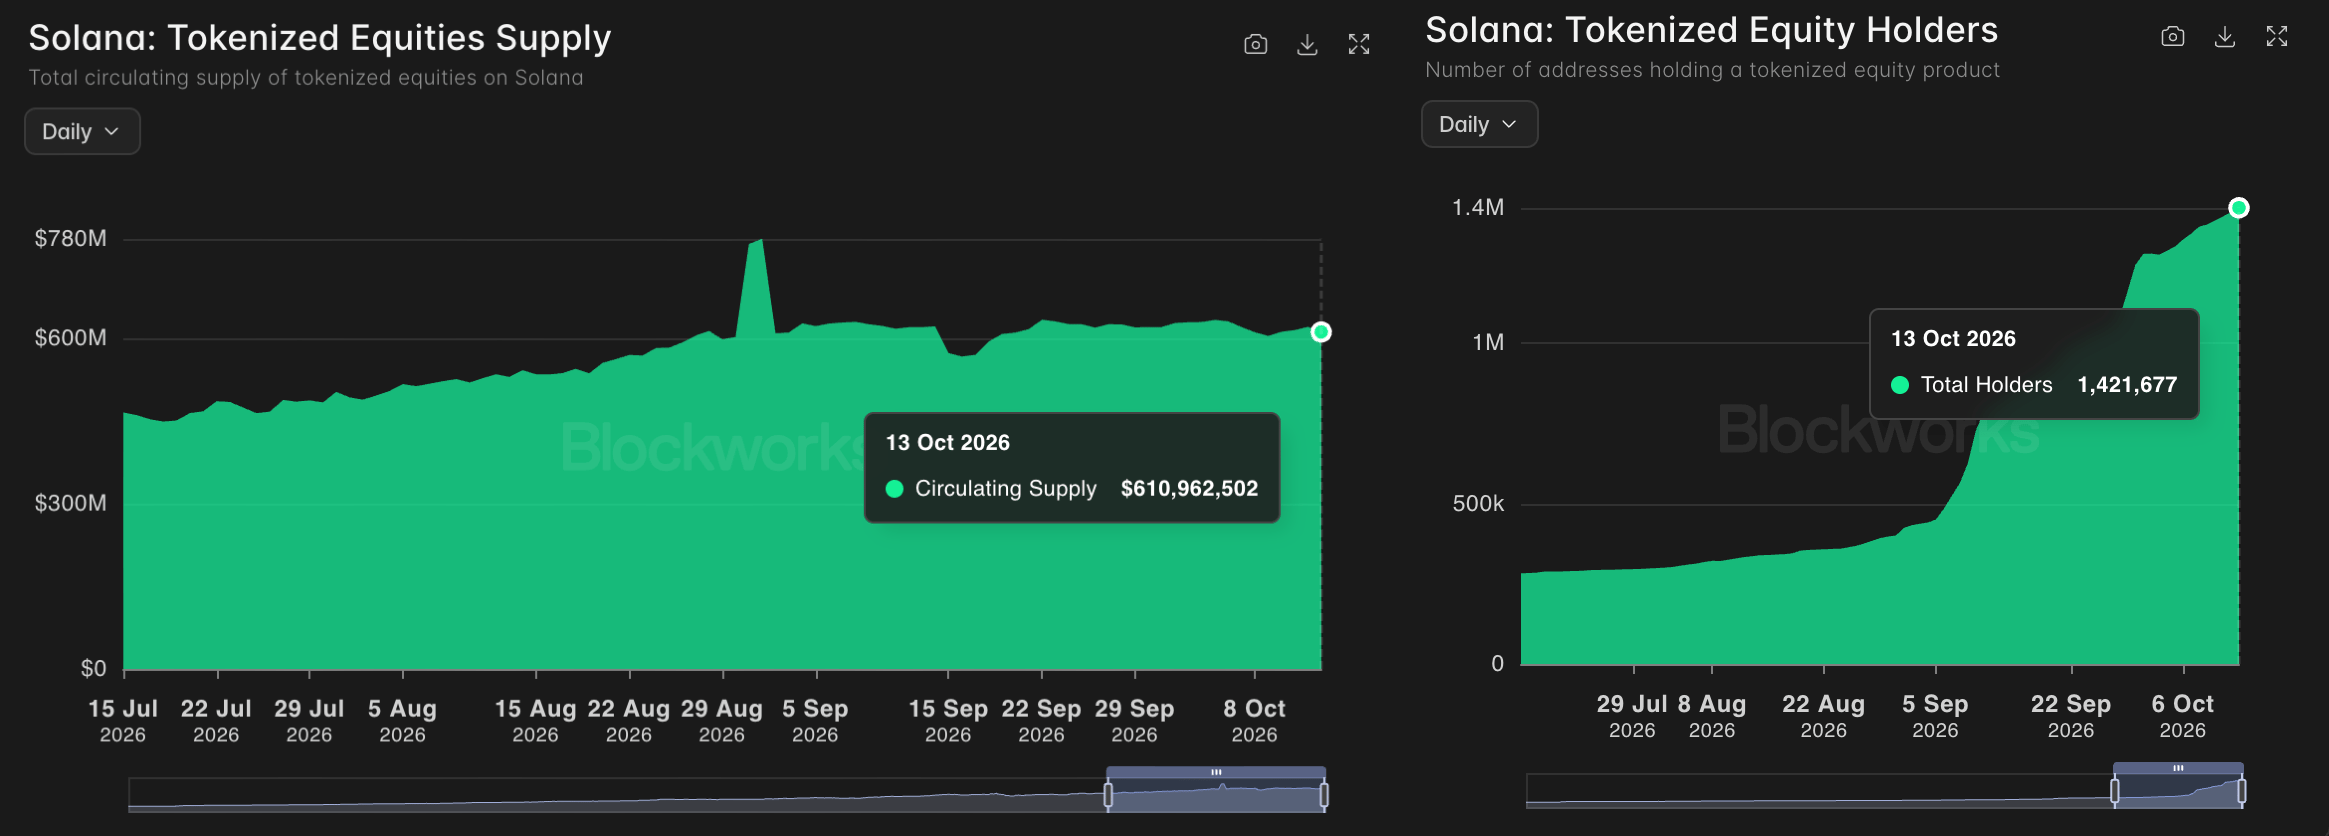
  • Solana sees steady growth in tokenized assets, with over $600 million in tokenized equity supply across 1.4 million holders.

Solana (SOL) price extends losses on Thursday, inching lower to the $100 mark after a 2% retreat from the 50-day Exponential Moving Average (EMA) at $107.13 the previous day. The institutional demand remains weak, with eight consecutive days of outflows from SOL-focused Exchange Traded Funds (ETFs). Tokenized assets rise on Solana, with over $600 million in tokenized equity supply across 1.4 million holders.

The technical outlook for Solana indicates a downside bias as bearish pressure mounts.

Solana ETFs face consistent selling pressure

Solana-focused ETFs are experiencing an extended selloff, driven by consistent investor redemptions over the last week. SoSoValue data shows SOL ETFs marked their eighth consecutive day of outflows, with $1.29 million on Wednesday and extending last week’s $24.81 million.

On the other hand, the tokenized assets on Solana are rising. Blockworks data shows tokenized equity supply rising to nearly $611 million on Tuesday, distributed across 1.42 million holders. 
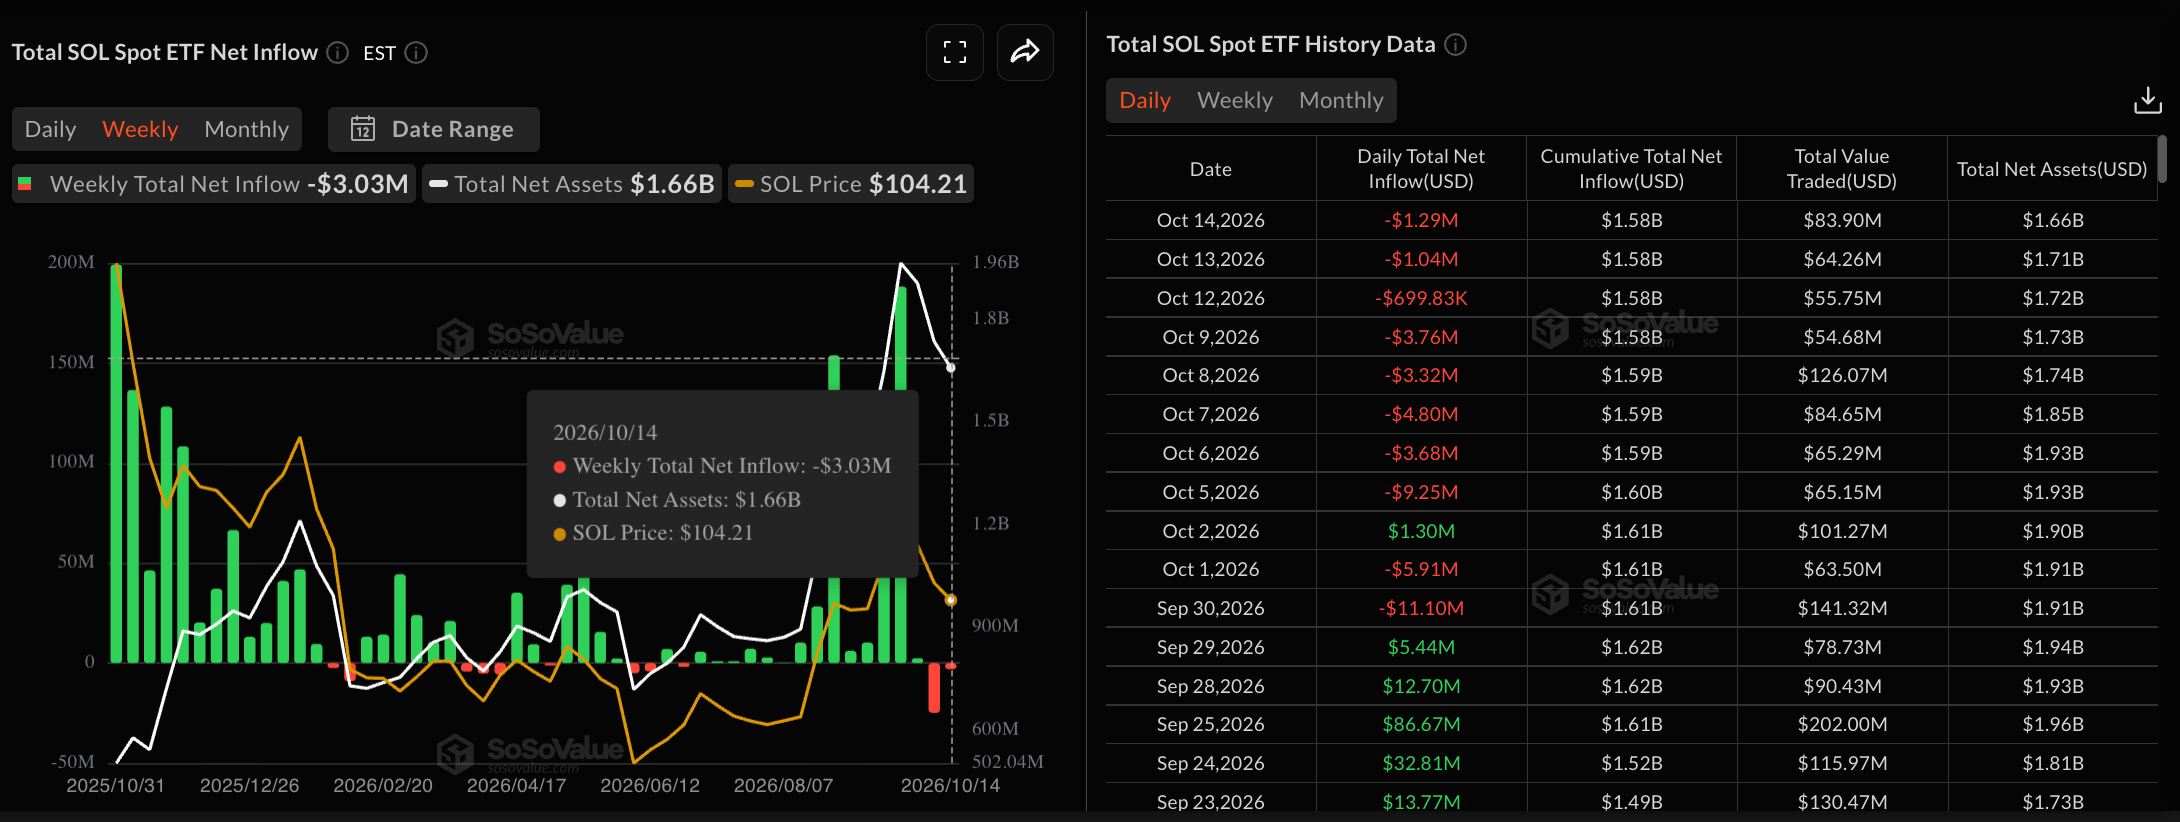
SOL ETFs data. Source: Sosovalue
Solana tokenized assets data. Source: Blockworks

Technical outlook: Could Solana's price fall below $100?

Solana trades around $102.50 at press time on Thursday, maintaining a bearish near-term bias after a double-top reversal from $122 in early October. The SOL price is down over 13% so far in October, crossing below the 50-day EMA at $107.13. Still, SOL remains above the 200-day EMA at $97.95, suggesting a corrective phase within a broader uptrend.

Downside pressure remains firm on the daily chart, with the Moving Average Convergence Divergence (MACD) below its signal and zero line, while the Relative Strength Index (RSI) near 35 suggests that sellers remain in control.

Looking down, the 200-day EMA at $97.95 offers the first meaningful support zone. A clear drop through this level would likely expose deeper losses, aligning with the May 17 high at $83.50.

Chart Analysis SOL/USDT (Binance)
SOL/USDT daily price chart.

On the flip side, initial resistance is located at the 50-day EMA around $107.13. A sustained break above this barrier would be needed to ease the current bearish tone before the more distant horizontal cap near the September 25 high at $122.94 comes into view.

(The technical analysis of this story was written with the help of an AI tool. Know more.)

Disclaimer: For information purposes only. Past performance is not indicative of future results.
placeholder
Smart Money is Leaving Nvidia for This AI Chip StockNvidia stock price keeps sliding, yet the usual dip buyers are missing. Institutional money flow on the stock is the most negative of any major chip name, which means big investors are stepping back i
Author  Beincrypto
Jun 30, Tue
Nvidia stock price keeps sliding, yet the usual dip buyers are missing. Institutional money flow on the stock is the most negative of any major chip name, which means big investors are stepping back i
placeholder
XAUUSD Gold Analysis: Gold Holds Above $4,350 Ahead of US Inflation Data Is $4,500 Next? Gold holds above $4,350 following weak US jobs data. As inflation reports approach and UBS eyes $5,000, can XAUUSD break resistance at $4,435 to rally toward $4,500?
Author  Naoufal Seddik
Aug 12, Wed
Gold holds above $4,350 following weak US jobs data. As inflation reports approach and UBS eyes $5,000, can XAUUSD break resistance at $4,435 to rally toward $4,500?
placeholder
Gold Price Analysis Today: Gold Drops 1.32% Despite Lower Fed Rate-Hike Bets, Can $4,313 Support Hold? Gold fell 1.32% on August 13 after rising to $4,449.73, then reversing lower and closing near $4,349.918 below the $4,356.46 support. Softer US inflation data reduced Fed rate hike expectations, but selling pressure still dominated the session. Will $4,313 support hold?
Author  Naoufal Seddik
Aug 14, Fri
Gold fell 1.32% on August 13 after rising to $4,449.73, then reversing lower and closing near $4,349.918 below the $4,356.46 support. Softer US inflation data reduced Fed rate hike expectations, but selling pressure still dominated the session. Will $4,313 support hold?
placeholder
Gold Price Analysis Today: Gold Gains 0.94% as Markets Expect Fed to Hold Rates, Can $4,449 Resistance Break? Gold gained 0.94% on August 17, closing near $4,417.30 as softer US data strengthened expectations for unchanged Fed rates in September. Gold remains bullish, with $4,449.730 resistance and $4,310.650 support in focus.
Author  Naoufal Seddik
Aug 18, Tue
Gold gained 0.94% on August 17, closing near $4,417.30 as softer US data strengthened expectations for unchanged Fed rates in September. Gold remains bullish, with $4,449.730 resistance and $4,310.650 support in focus.
placeholder
3 Stocks That Can Benefit From SpaceX’s Surprise Q3 EarningsSpaceX’s latest earnings have given Wall Street a reason to revisit AI hardware stocks. Elon Musk’s company is preparing to spend billions more on computing infrastructure, and three US-listed stocks
Author  Beincrypto
Oct 21, Wed
SpaceX’s latest earnings have given Wall Street a reason to revisit AI hardware stocks. Elon Musk’s company is preparing to spend billions more on computing infrastructure, and three US-listed stocks
Related Instrument
goTop
quote