


Crypto Today: Bitcoin, Ethereum, XRP face headwinds as Fed decision looms
- Bitcoin declines for the second straight day and trades near $76,000 ahead of the Fed monetary policy decision.
- Ethereum is under pressure near lower support levels, weighed down by $141 million in ETF outflows.
- XRP dips and stays below the 50-day and 200-day EMAs, moving in tandem with downtrending momentum indicators.
Cryptocurrency prices are broadly retreating on Wednesday, with Bitcoin (BTC) holding near $75,000. Ethereum (ETH) holds below the support-turned-resistance at $2,400 while remaining structurally resilient. Meanwhile, Ripple (XRP) is trading lethargically below $1.30, suggesting growing risk-off sentiment after Monday’s surge near $1.50.
Uncertainty grips risk assets ahead of Fed decision
The United States (US) Federal Reserve (Fed) is widely expected to raise interest rates to 3.75%-4.00% later on Wednesday, potentially weighing on risk assets. According to the FedWatch tool, market participants are pricing in 92.5% odds of a rate hike.
Analysts argue that recent inflation pressures, coupled with elevated Crude Oil prices driven by sticky geopolitical tensions in the Middle East, could support the central bank’s need for tighter monetary policy.
The Crypto Finance team stated in Thursday’s market report that they “expect the FOMC announcement and subsequent press conference to be a major volatility catalyst, with the potential for sharp and erratic moves across asset classes.”
Moreover, the crypto CLARITY Act's failure to pass the Senate vote on Tuesday adds another layer of uncertainty, further weighing on sentiment. The odds of the bill becoming law in 2026 have further dwindled, with crypto executives expressing disappointment.
“The cost of today’s vote is the reset it forces. If CLARITY doesn’t move forward now, a new Congress will have to start over on what took years to draft, while the assets the bill was meant to govern keep moving towards markets that have already set their rules,” Michael Ho, the Co-Founder of D3, said in a comment.
Bitcoin, Ethereum ETFs turn bearish
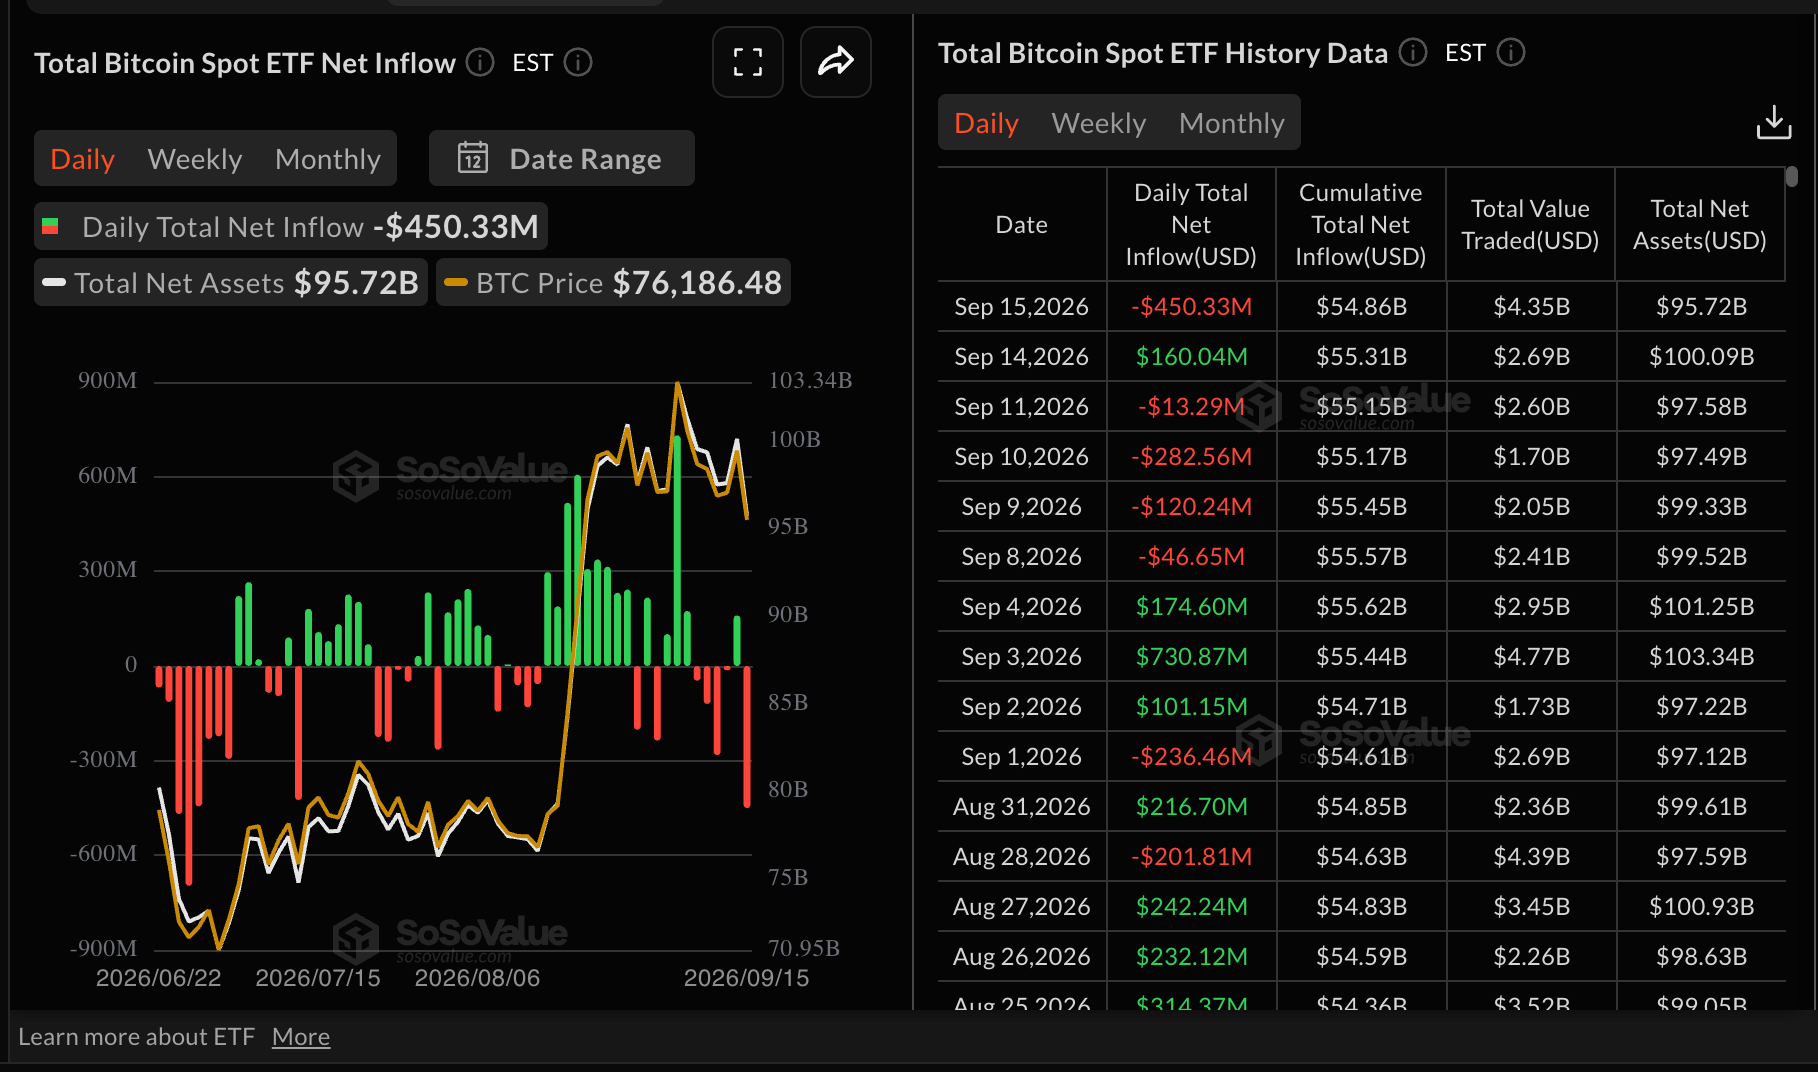
Current macro and regulatory headwinds prompted outflows from Bitcoin spot Exchange-Traded Funds (ETFs) amounting to $450 million on Tuesday, following inflows of $160 million the previous day. If the uncertainty persists, interest in US-listed ETFs may continue to sell off, with cumulative inflows falling from the current $55 billion.
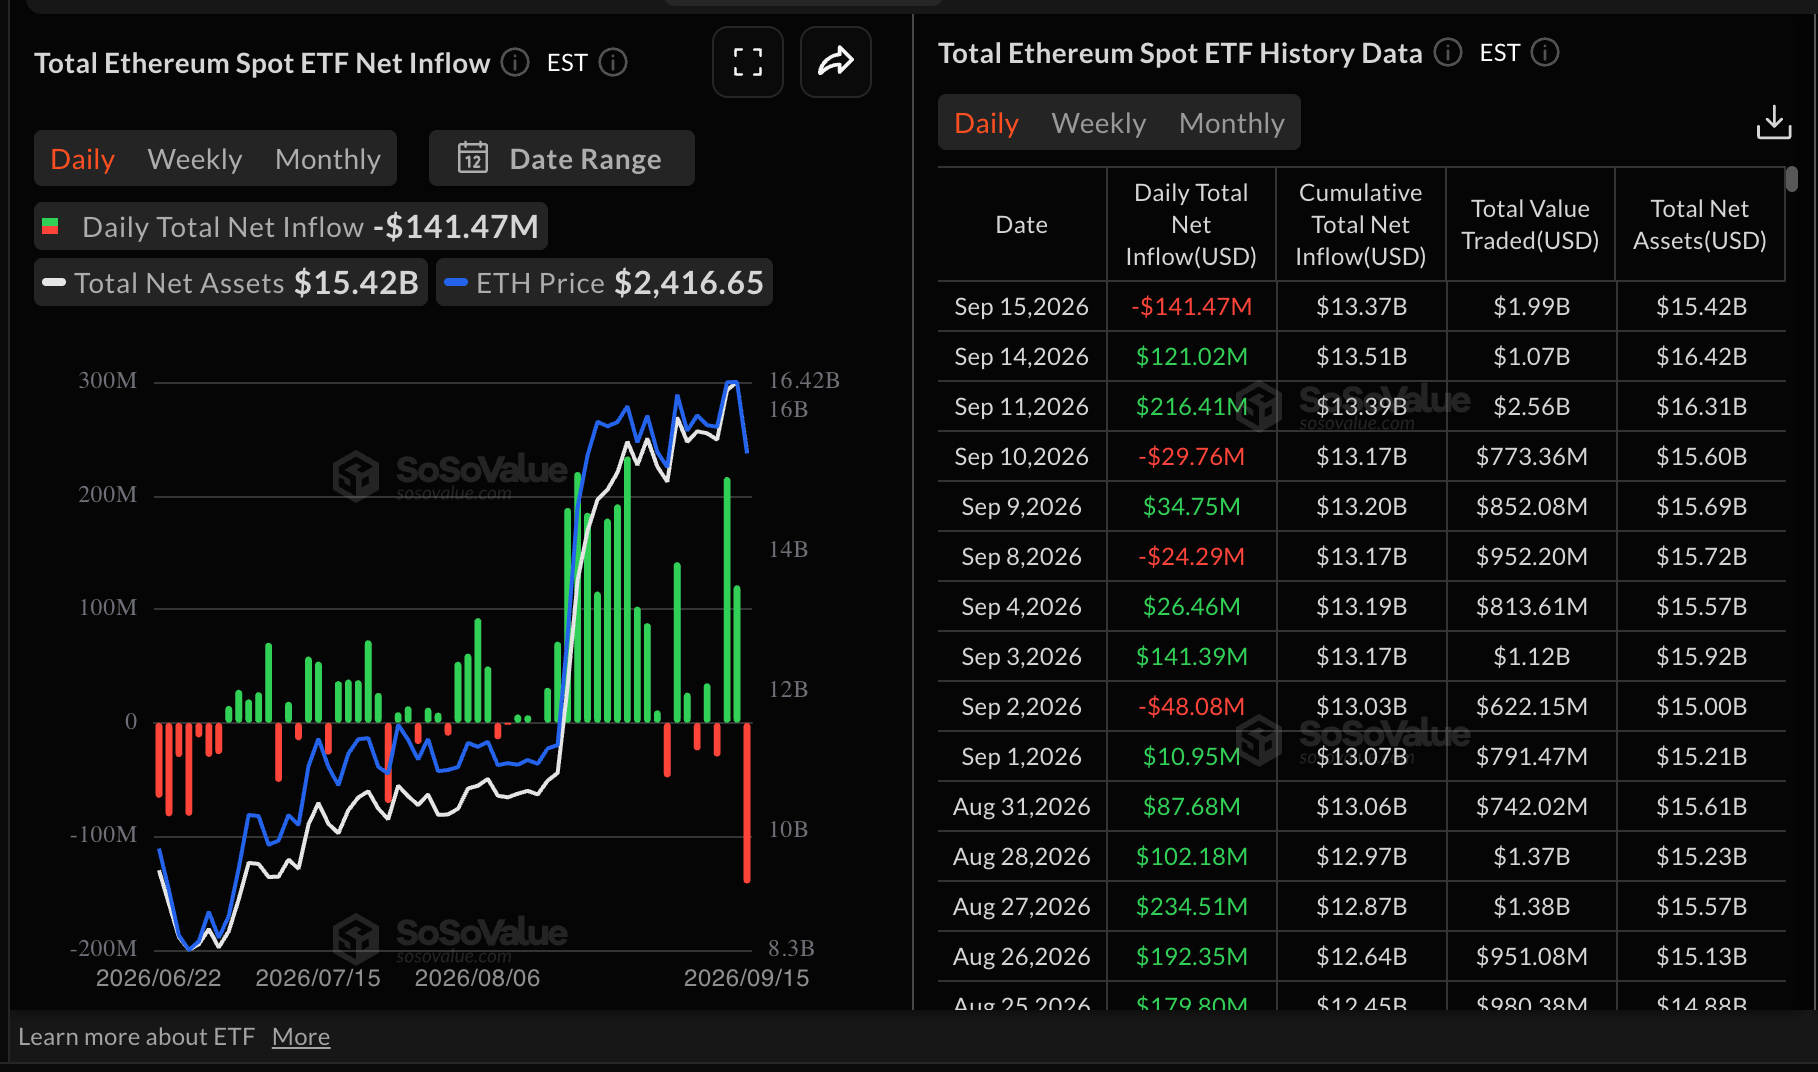
Ethereum spot ETFs similarly saw outflows totaling $141 million on Tuesday, compared with $121 million in inflows the day before and $216 million deposited on Friday.
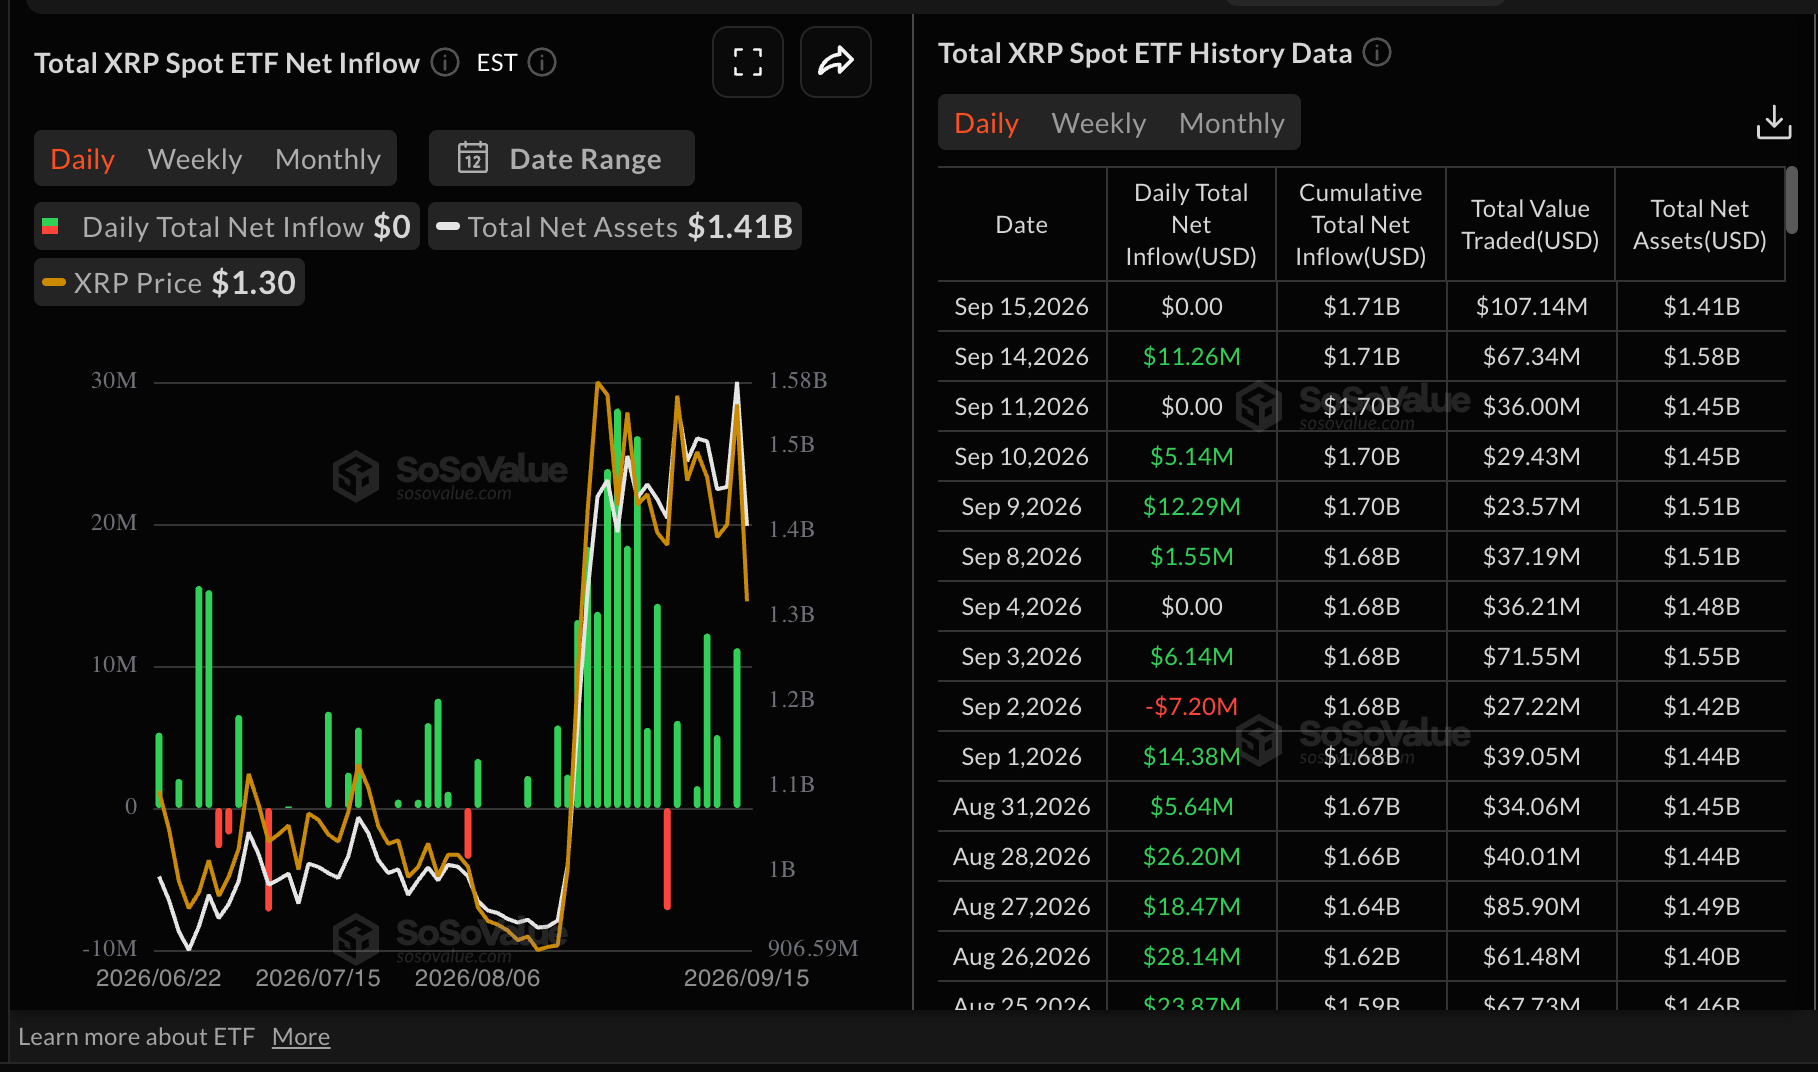
As for US-listed XRP spot ETFs, activity remained muted on Tuesday after a sharp increase in flows of $11 million the previous day. Cumulative inflows stand at $1.71 billion, with net assets under management averaging $1.41 billion.
Technical analysis: Bitcoin bulls lose ground
Bitcoin remains under pressure near lower support at $75,000, marking the second straight day of declines. Still, BTC holds a constructive near-term bias as price stays comfortably above the 50-day, 100-day and 200-day Exponential Moving Averages (EMAs), which cluster between roughly $71,400 and $73,600 and suggest a well-supported medium-term uptrend.
However, momentum has cooled, as the Relative Strength Index (RSI) hovers around 48 and the Moving Average Convergence Divergence (MACD) stays below zero with negative readings, suggesting upside follow-through may slow even as the broader structure remains underpinned.
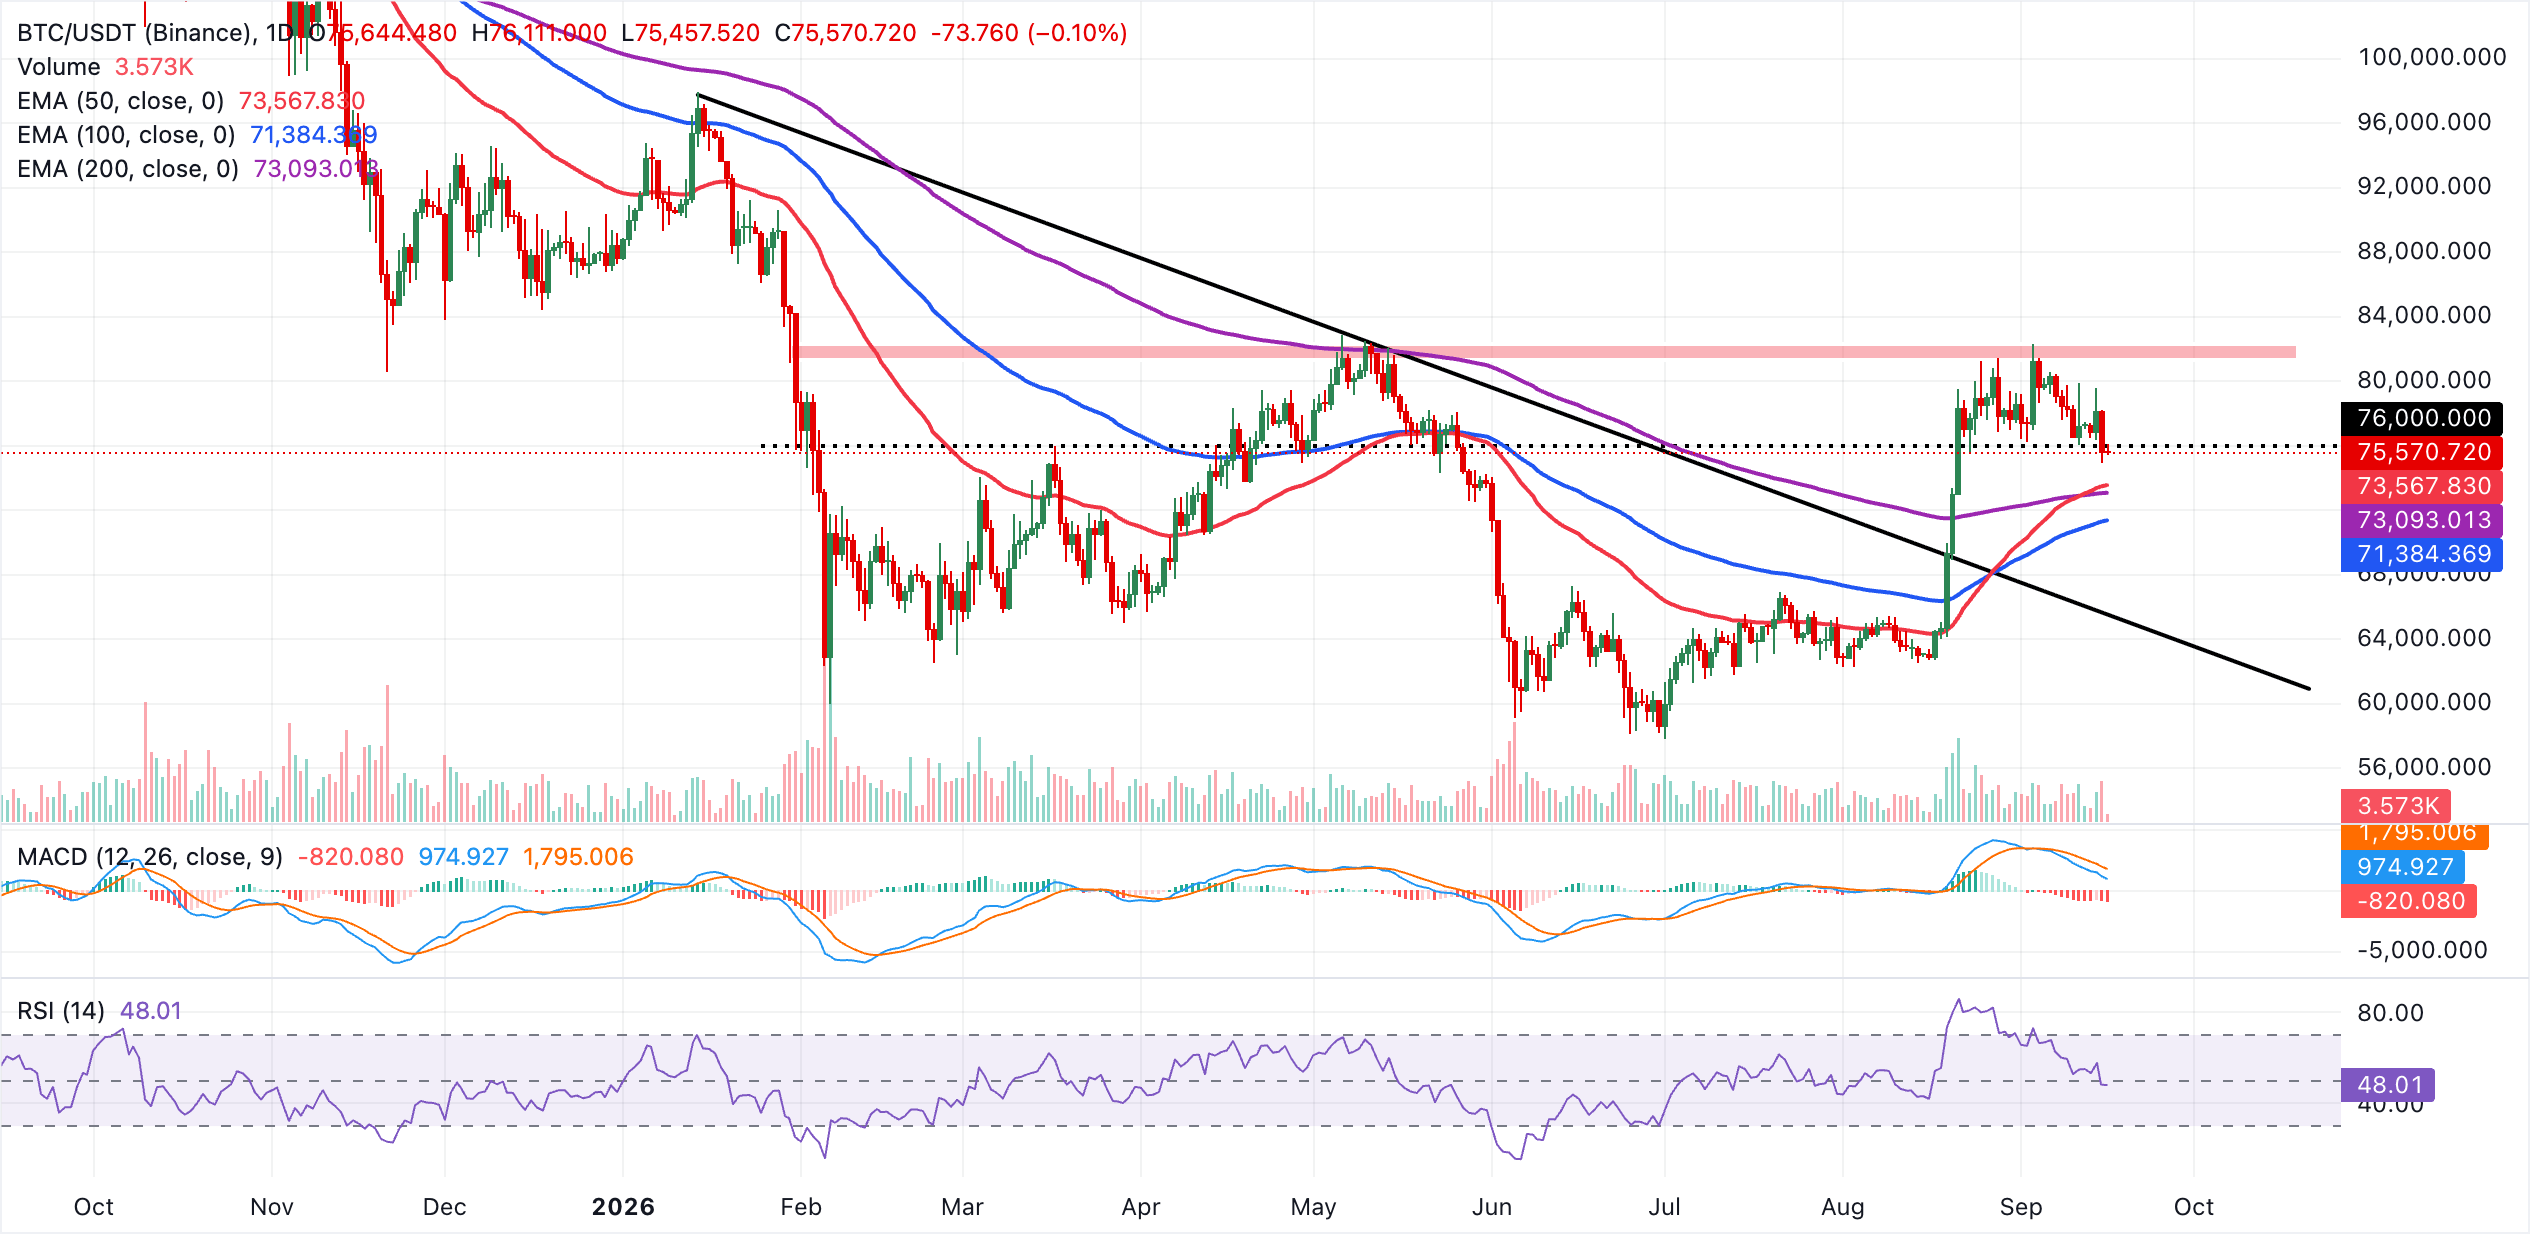
On the downside, initial support lies around the 50-day EMA near $73,568, reinforced by the 200-day EMA at $73,093, while deeper pullbacks would look to the 100-day EMA around $71,384 as a more substantial demand area. Below that, the prior downward resistance trend line, now turned support around $65,494, marks a more distant structural floor. A break would materially weaken the current bullish backdrop.
Altcoins technical outlook: Ethereum and XRP sell-side pressure intensifies
Ethereum is trading below $2,400, while still holding a constructive bias as it consolidates well above its main EMAs. The 50-day EMA at $2,275, the 100-day EMA near $2,156 and the 200-day EMA at $2,206 all sit comfortably below spot, suggesting the broader uptrend remains supported despite the latest pullback.
Momentum, however, has cooled, with the RSI hovering near the neutral 50 line and the MACD staying in negative territory, hinting that upside follow-through could remain tentative in the very near term.
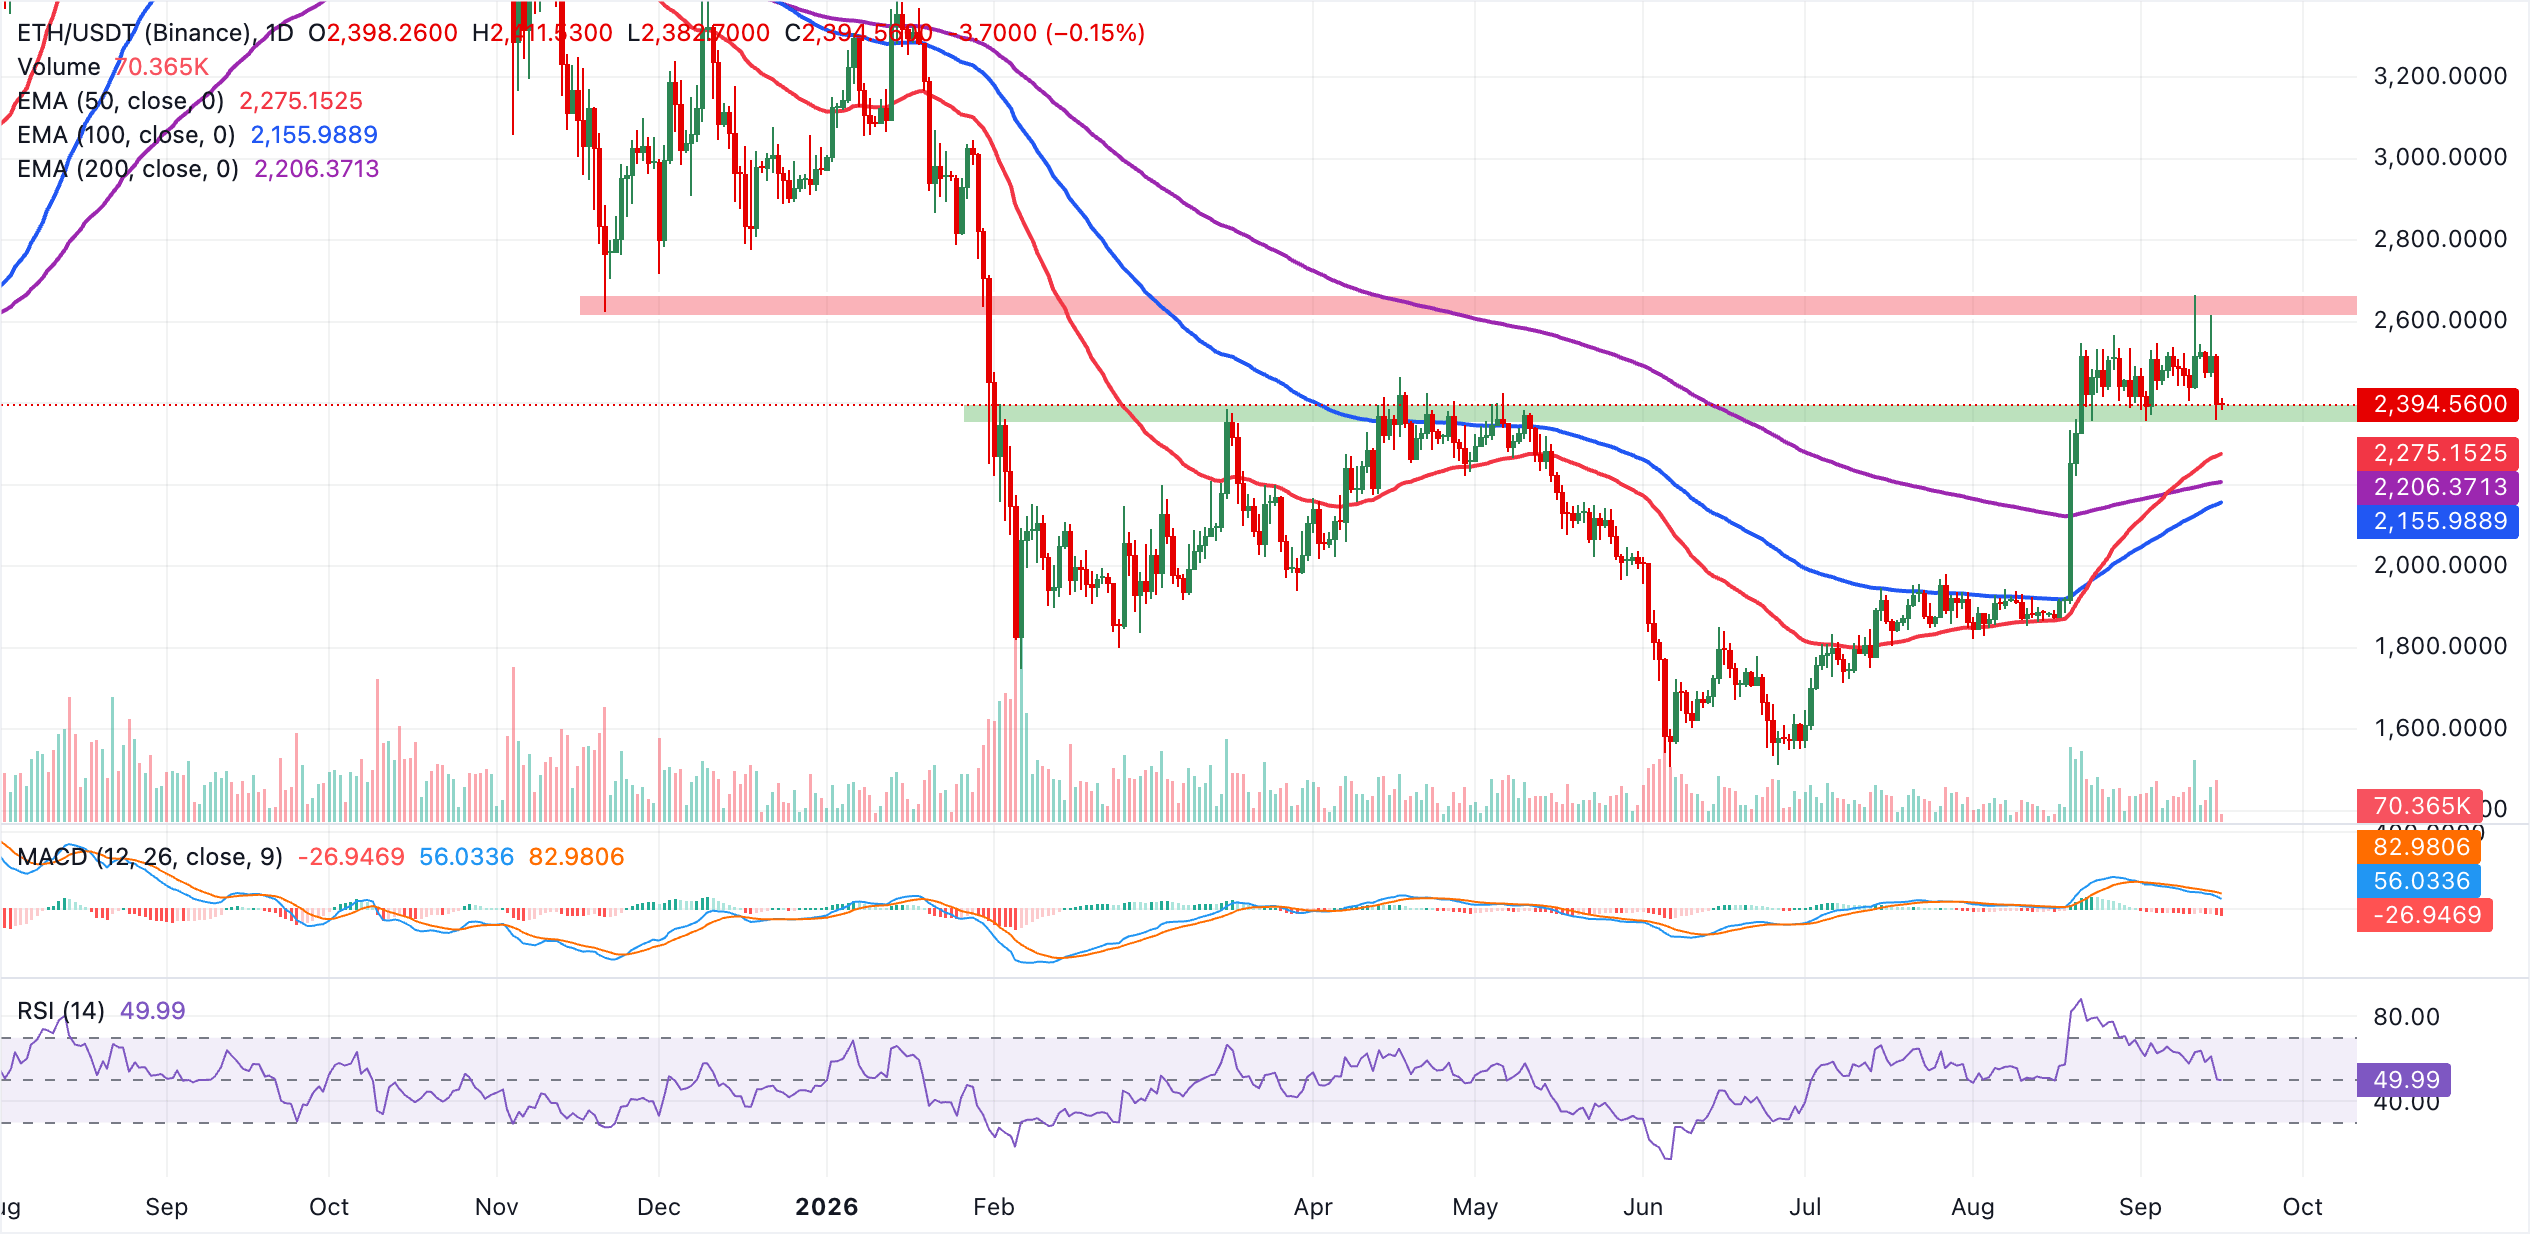
On the downside, immediate support lies at the recent pivot zone near the current price, with the $2,275 area marked by the 50-day EMA as the first meaningful buffer if sellers press lower. Further down, the 100-day EMA at roughly $2,156 and the 200-day EMA near $2,206 form a broader demand band that would be expected to attract dip-buying interest on a deeper correction, as long as price continues to trade above this cluster of medium and long-term averages.
XRP, meanwhile, trades at $1.28, maintaining a bearish near-term tone. The RSI around 45 and a negative MACD reading both hint that momentum has shifted toward sellers, suggesting rallies could stay capped while the pair trades under these overhead averages.
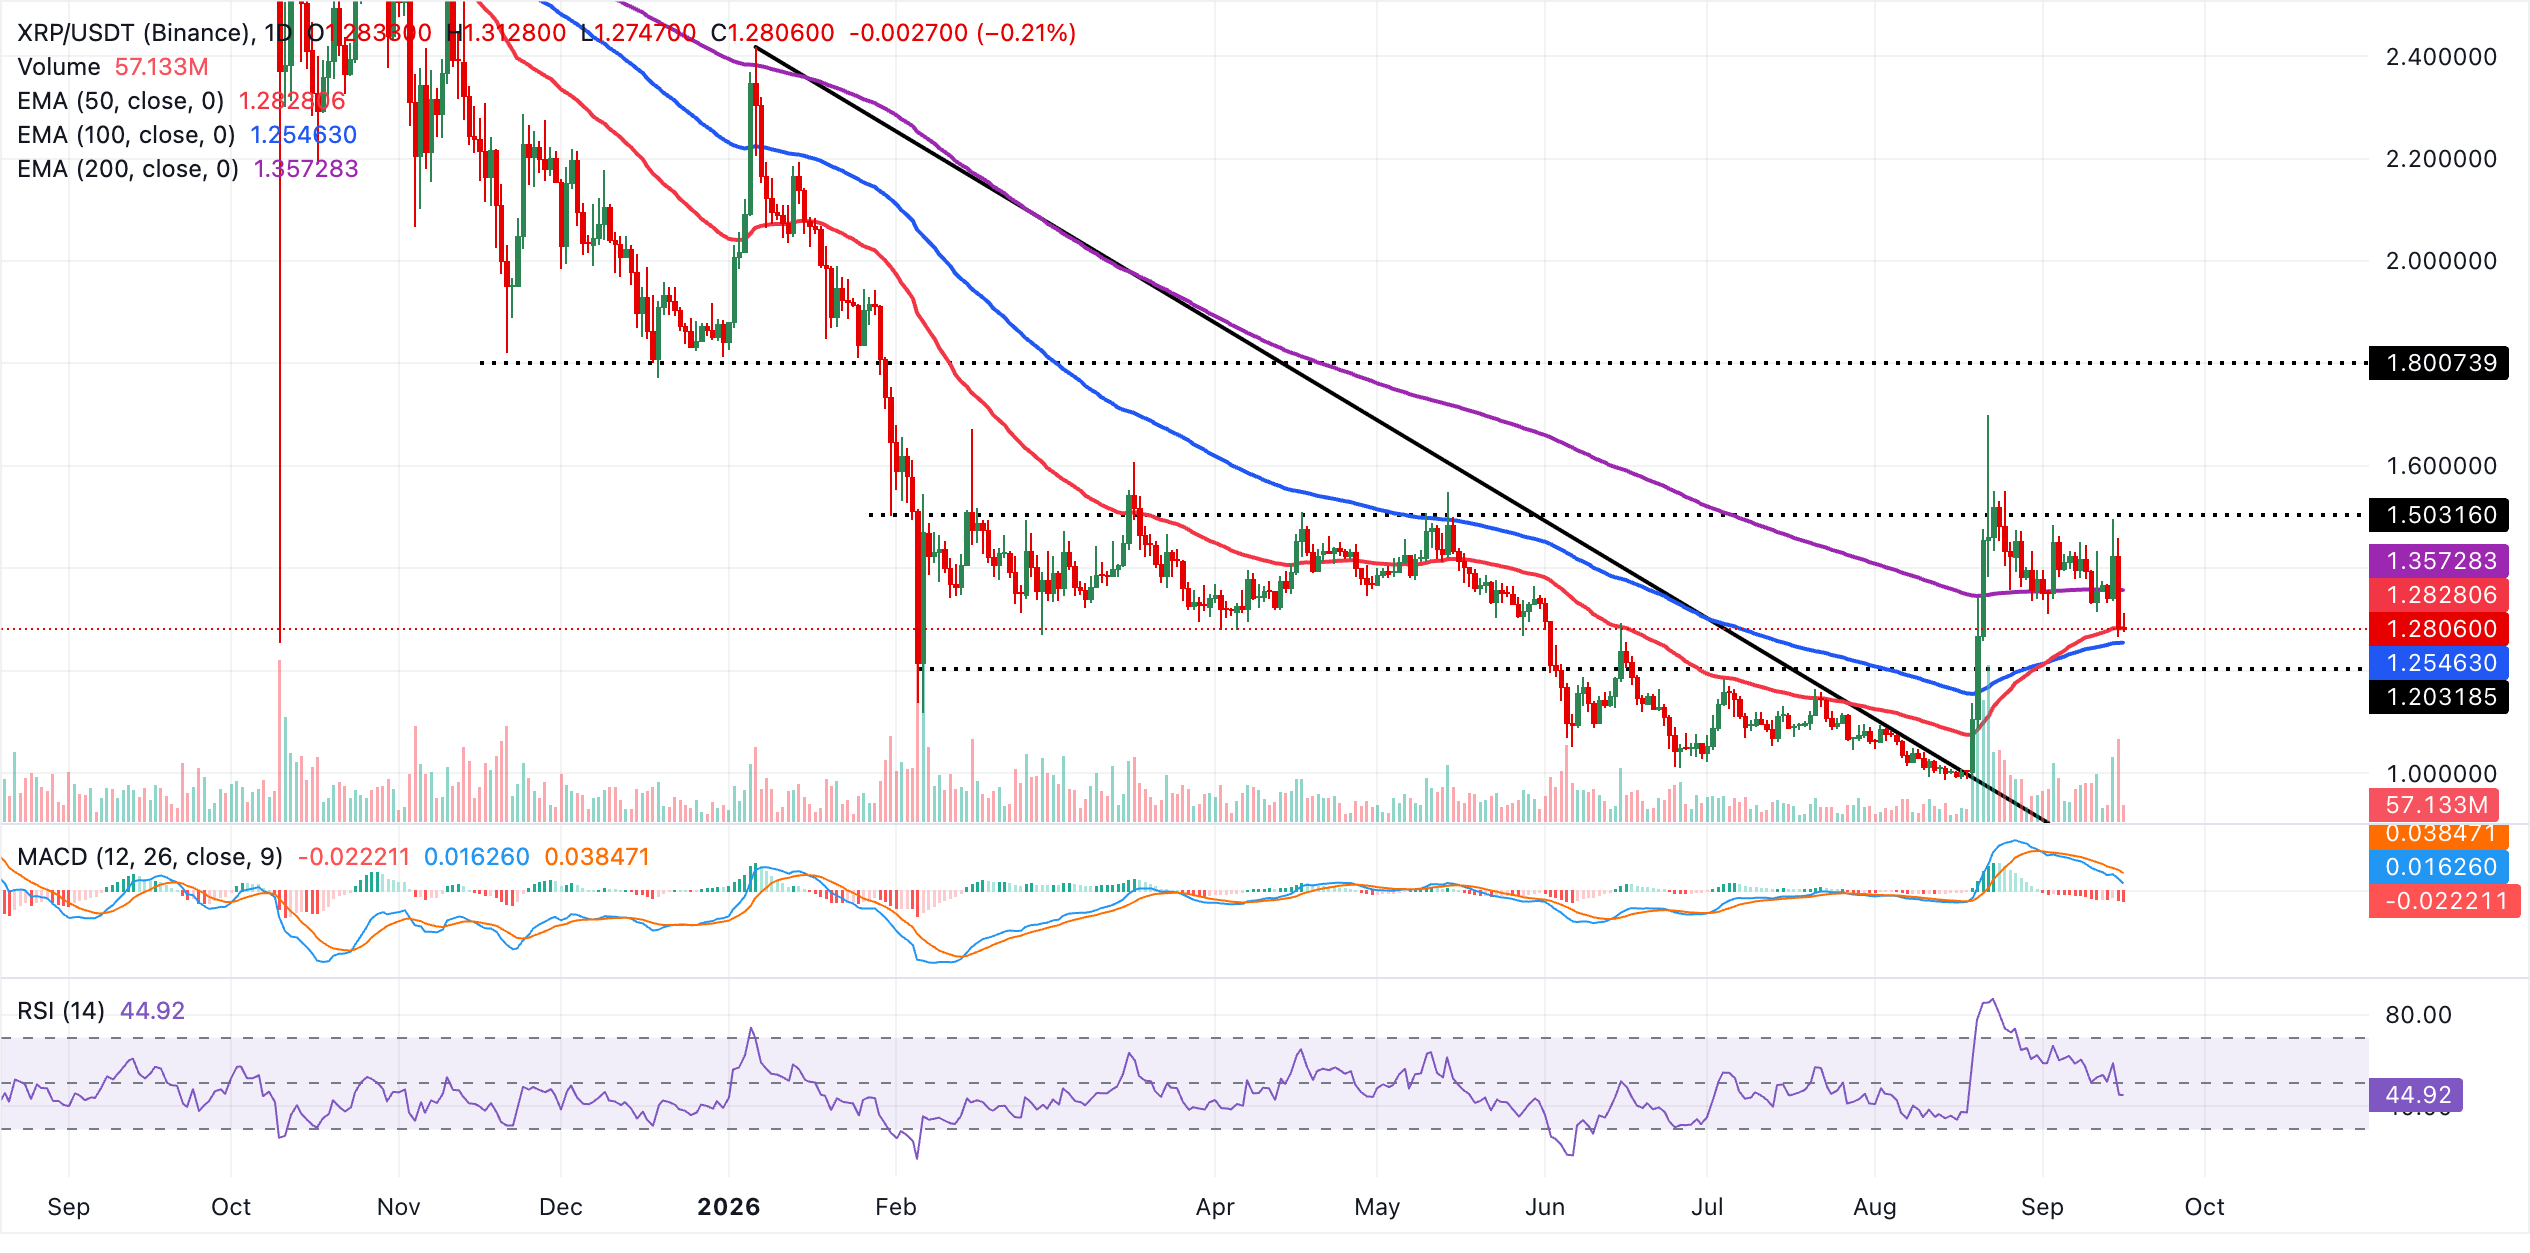
On the topside, initial resistance appears at the 50-day EMA near $1.28, with stronger supply at the 200-day EMA around $1.36, followed by key psychological levels at $1.40 and $1.50. On the downside, the 100-day EMA at roughly $1.25 is the first meaningful support. A clear break below this level would expose lower support and open the door to a deeper corrective leg in the coming sessions.
(The technical analysis of this story was written with the help of an AI tool. Know more.)
Crypto ETF FAQs
An Exchange-Traded Fund (ETF) is an investment vehicle or an index that tracks the price of an underlying asset. ETFs can not only track a single asset, but a group of assets and sectors. For example, a Bitcoin ETF tracks Bitcoin’s price. ETF is a tool used by investors to gain exposure to a certain asset.
Yes. The first Bitcoin futures ETF in the US was approved by the US Securities & Exchange Commission in October 2021. A total of seven Bitcoin futures ETFs have been approved, with more than 20 still waiting for the regulator’s permission. The SEC says that the cryptocurrency industry is new and subject to manipulation, which is why it has been delaying crypto-related futures ETFs for the last few years.
Yes. The SEC approved in January 2024 the listing and trading of several Bitcoin spot Exchange-Traded Funds, opening the door to institutional capital and mainstream investors to trade the main crypto currency. The decision was hailed by the industry as a game changer.
The main advantage of crypto ETFs is the possibility of gaining exposure to a cryptocurrency without ownership, reducing the risk and cost of holding the asset. Other pros are a lower learning curve and higher security for investors since ETFs take charge of securing the underlying asset holdings. As for the main drawbacks, the main one is that as an investor you can’t have direct ownership of the asset, or, as they say in crypto, “not your keys, not your coins.” Other disadvantages are higher costs associated with holding crypto since ETFs charge fees for active management. Finally, even though investing in ETFs reduces the risk of holding an asset, price swings in the underlying cryptocurrency are likely to be reflected in the investment vehicle too.
Recommended Articles


