


Crypto Overview: Bitcoin remains volatile amid CLARITY Act vote – Zcash, Stellar rally
- Bitcoin hovers around $78,000 on Tuesday, following a bullish start to the week with nearly 2% gains the previous day.
- The CLARITY Act advances toward a cloture vote on Tuesday after months of bipartisan discussions.
- Zcash and Stellar emerge as the top performers over the last 24 hours.
Bitcoin (BTC) holds steady around $78,000 on Tuesday, sustaining its roughly 2% recovery from the previous day. Broader cryptocurrency market volatility remains elevated ahead of the scheduled CLARITY Act cloture vote on Tuesday. Zcash (ZEC) and Stellar (XLM) retain bullish momentum, emerging as the top performers over the last 24 hours.
Bitcoin regains strength above key support level
Bitcoin hovers around $78,000 at press time on Tuesday, keeping a constructive bullish bias. Despite over 4% losses last week, BTC remains above the 50-, 100-, and 200-day Exponential Moving Averages (EMAs) at $73,579, $71,347, and $73,053, respectively.
Price also trades just over the 50% Fibonacci retracement at $75,233, measured over the $97,924 to $57,800 downswing, while it remains capped by a broken support-turned-resistance trendline near $82,850.
The Relative Strength Index (RSI) at around 57 on the daily chart suggests moderate positive momentum, even as the Moving Average Convergence Divergence (MACD) is below its signal line, hinting that upside pressure is waning.
On the topside, immediate resistance aligns at the overhead trendline near $82,850, followed by the 78.6% Fibonacci retracement near $87,476.
On the downside, initial support is seen at the 50% retracement at $75,233, followed by a broader demand band formed by the 50-day EMA near $73,579 and $73,127 and the 200-day EMA around 73,053.
Zcash and Stellar maintain an upward direction
Zcash trades above $1,150 on Tuesday, following a 9% rise the previous day. The privacy coin holds well above the 50-day EMA at roughly $828, the 100-day EMA at $683, and the 200-day EMA at roughly $554, keeping the broader structure bullish despite the recent loss of upside momentum.
In addition, the rising positive slopes of the crucial EMAs underscore a long-term uptrend. Momentum on the daily chart warns of easing upside pressure, as the MACD slips below its signal line, indicating a bearish crossover, while the RSI eases to 63, back in bullish territory from overbought levels, hinting at a maturing but still constructive advance.
Looking up, a confirmed breakout above last week's $1,296 record high could extend the Zcash rally toward the R3 Pivot Point at $1,435.
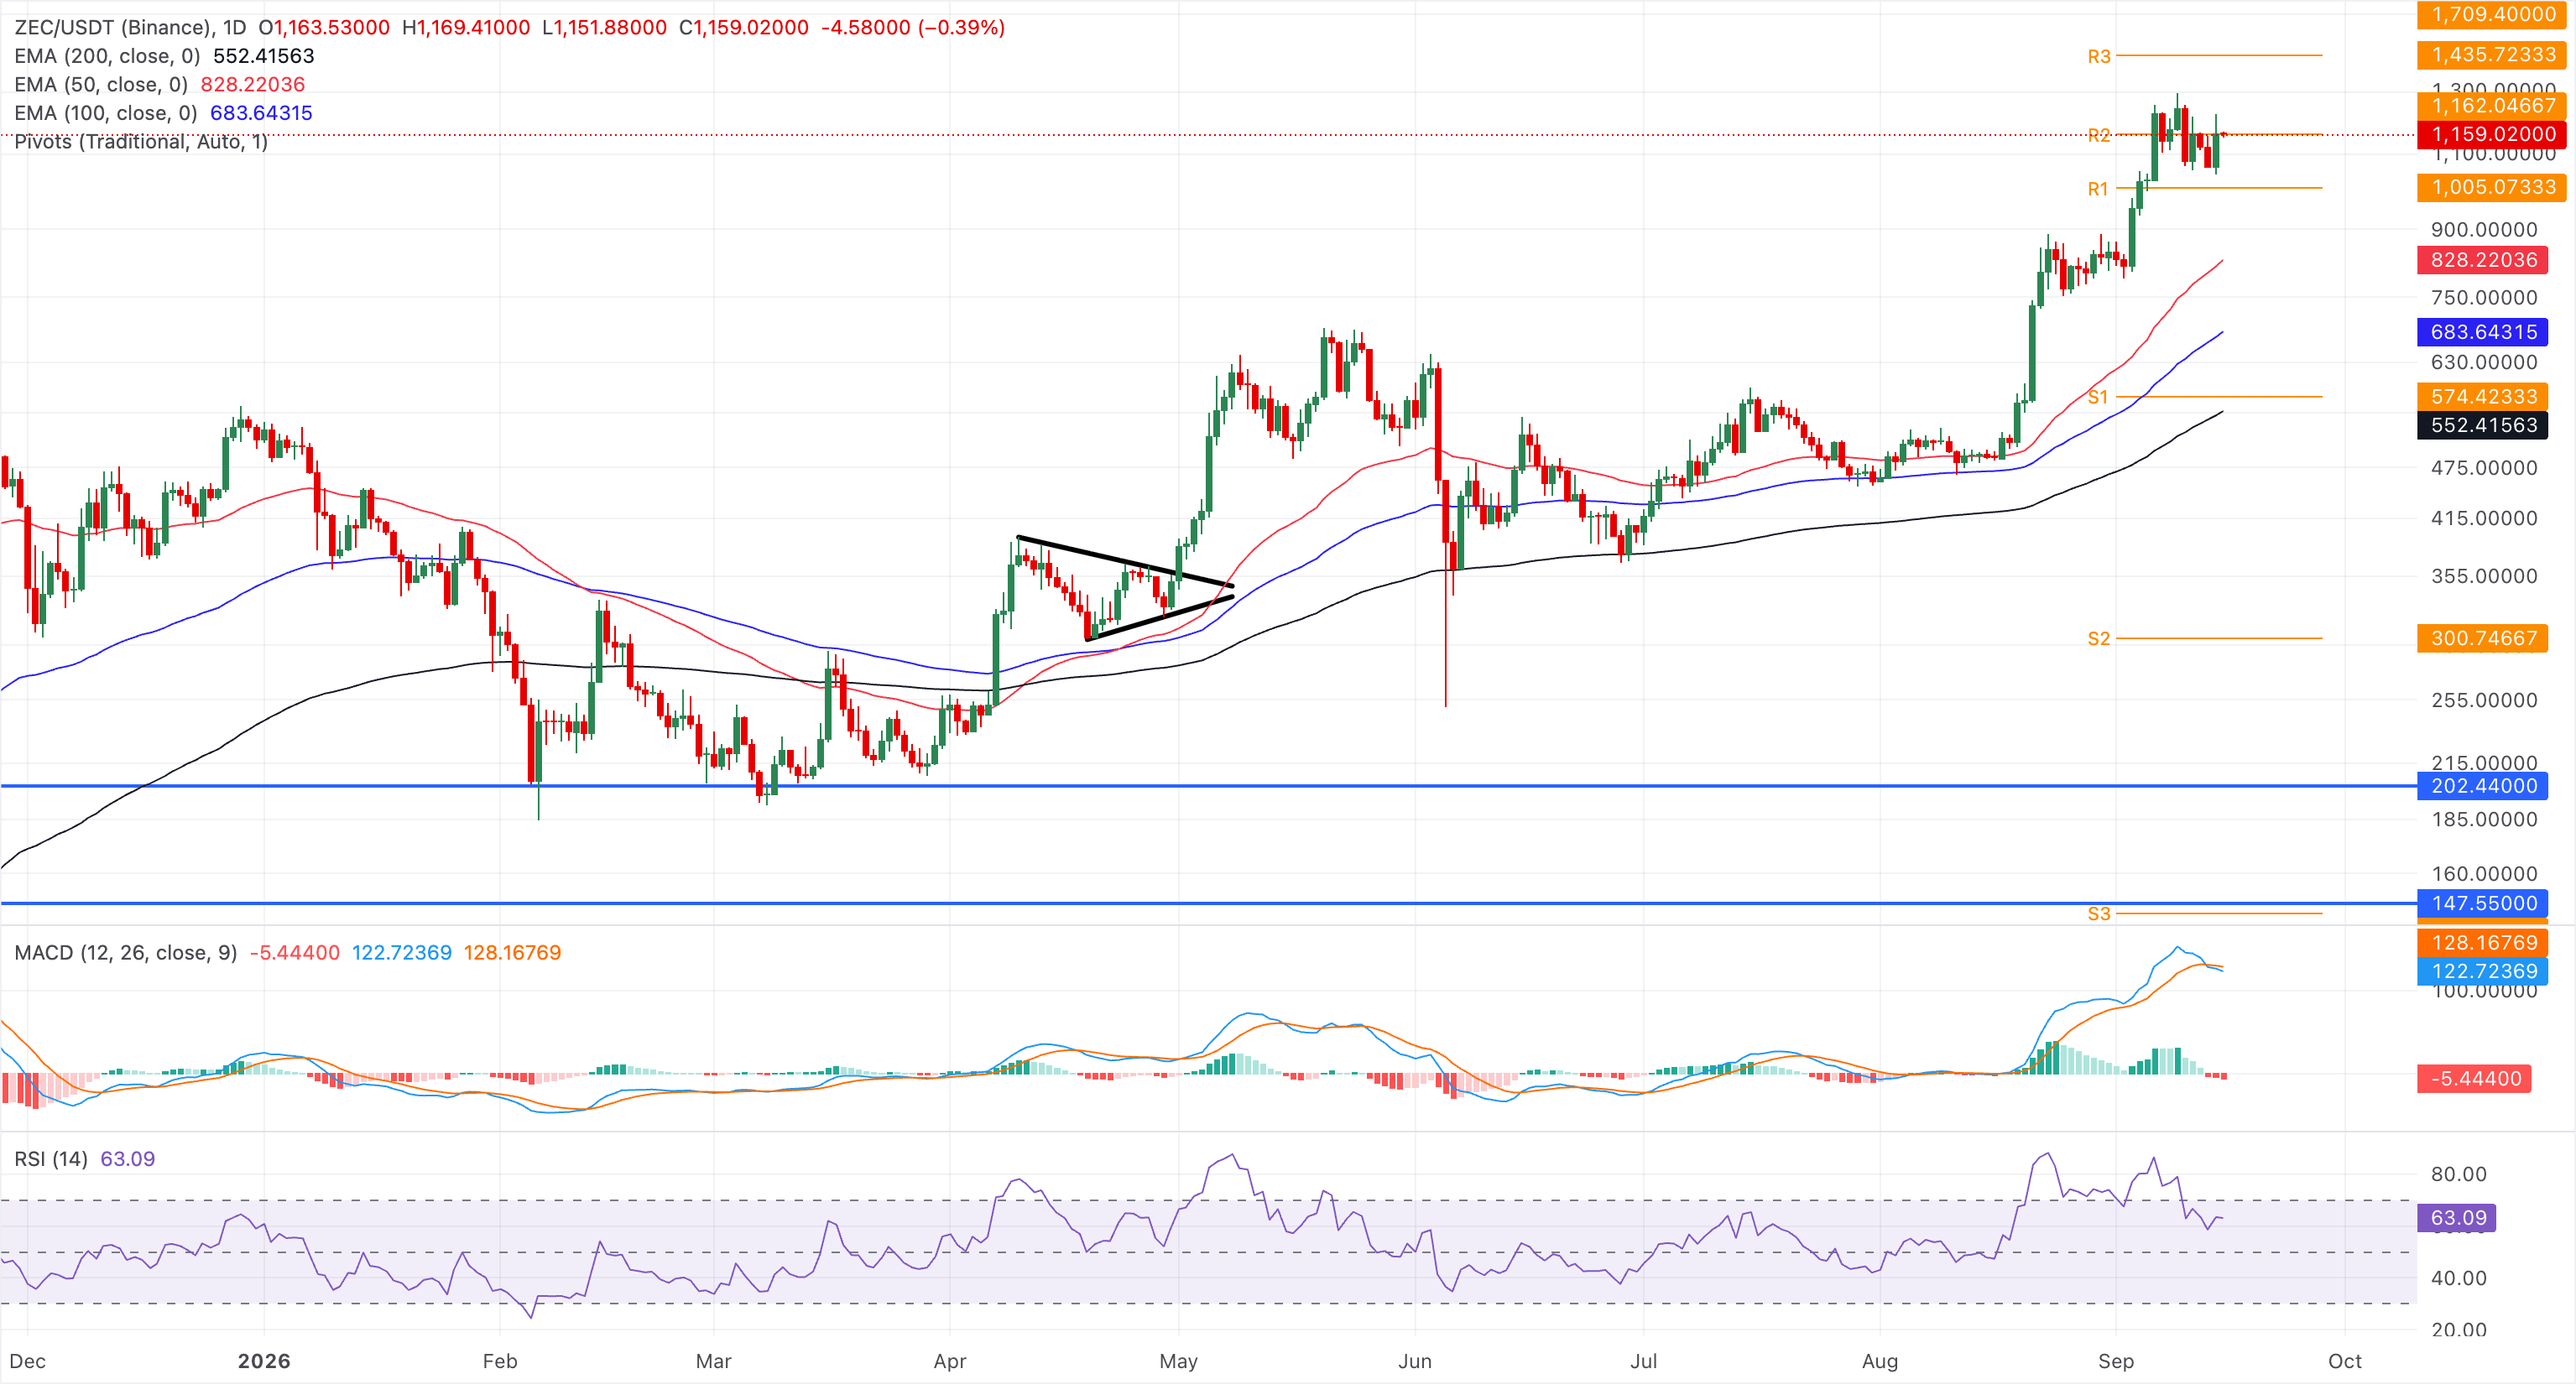
On the downside, initial support is seen at the R1 Pivot Point at $1,005, followed by the 50-day EMA around $828, with the 100-day EMA at $683 forming a deeper demand band ahead of the 200-day EMA at about $554.
Stellar is up 2% on Tuesday, extending its 8% gains from the previous day. XLM holds above the 200-day EMA at $0.1879, suggesting a constructive near-term bias.
Still, the price remains capped below a long-term resistance trendline connecting the highs of May 30 and August 22, near $0.2033. A confirmed breakout could face the next 50% retracement barrier of the $0.2982 to $0.1524 downswing at $0.2131, followed by the 78.6% Fibonacci retracement at $0.2582.
The RSI around 61 on the daily chart points to firm but not overextended momentum, and the MACD histogram has turned modestly positive, hinting that bullish pressure is rebuilding.
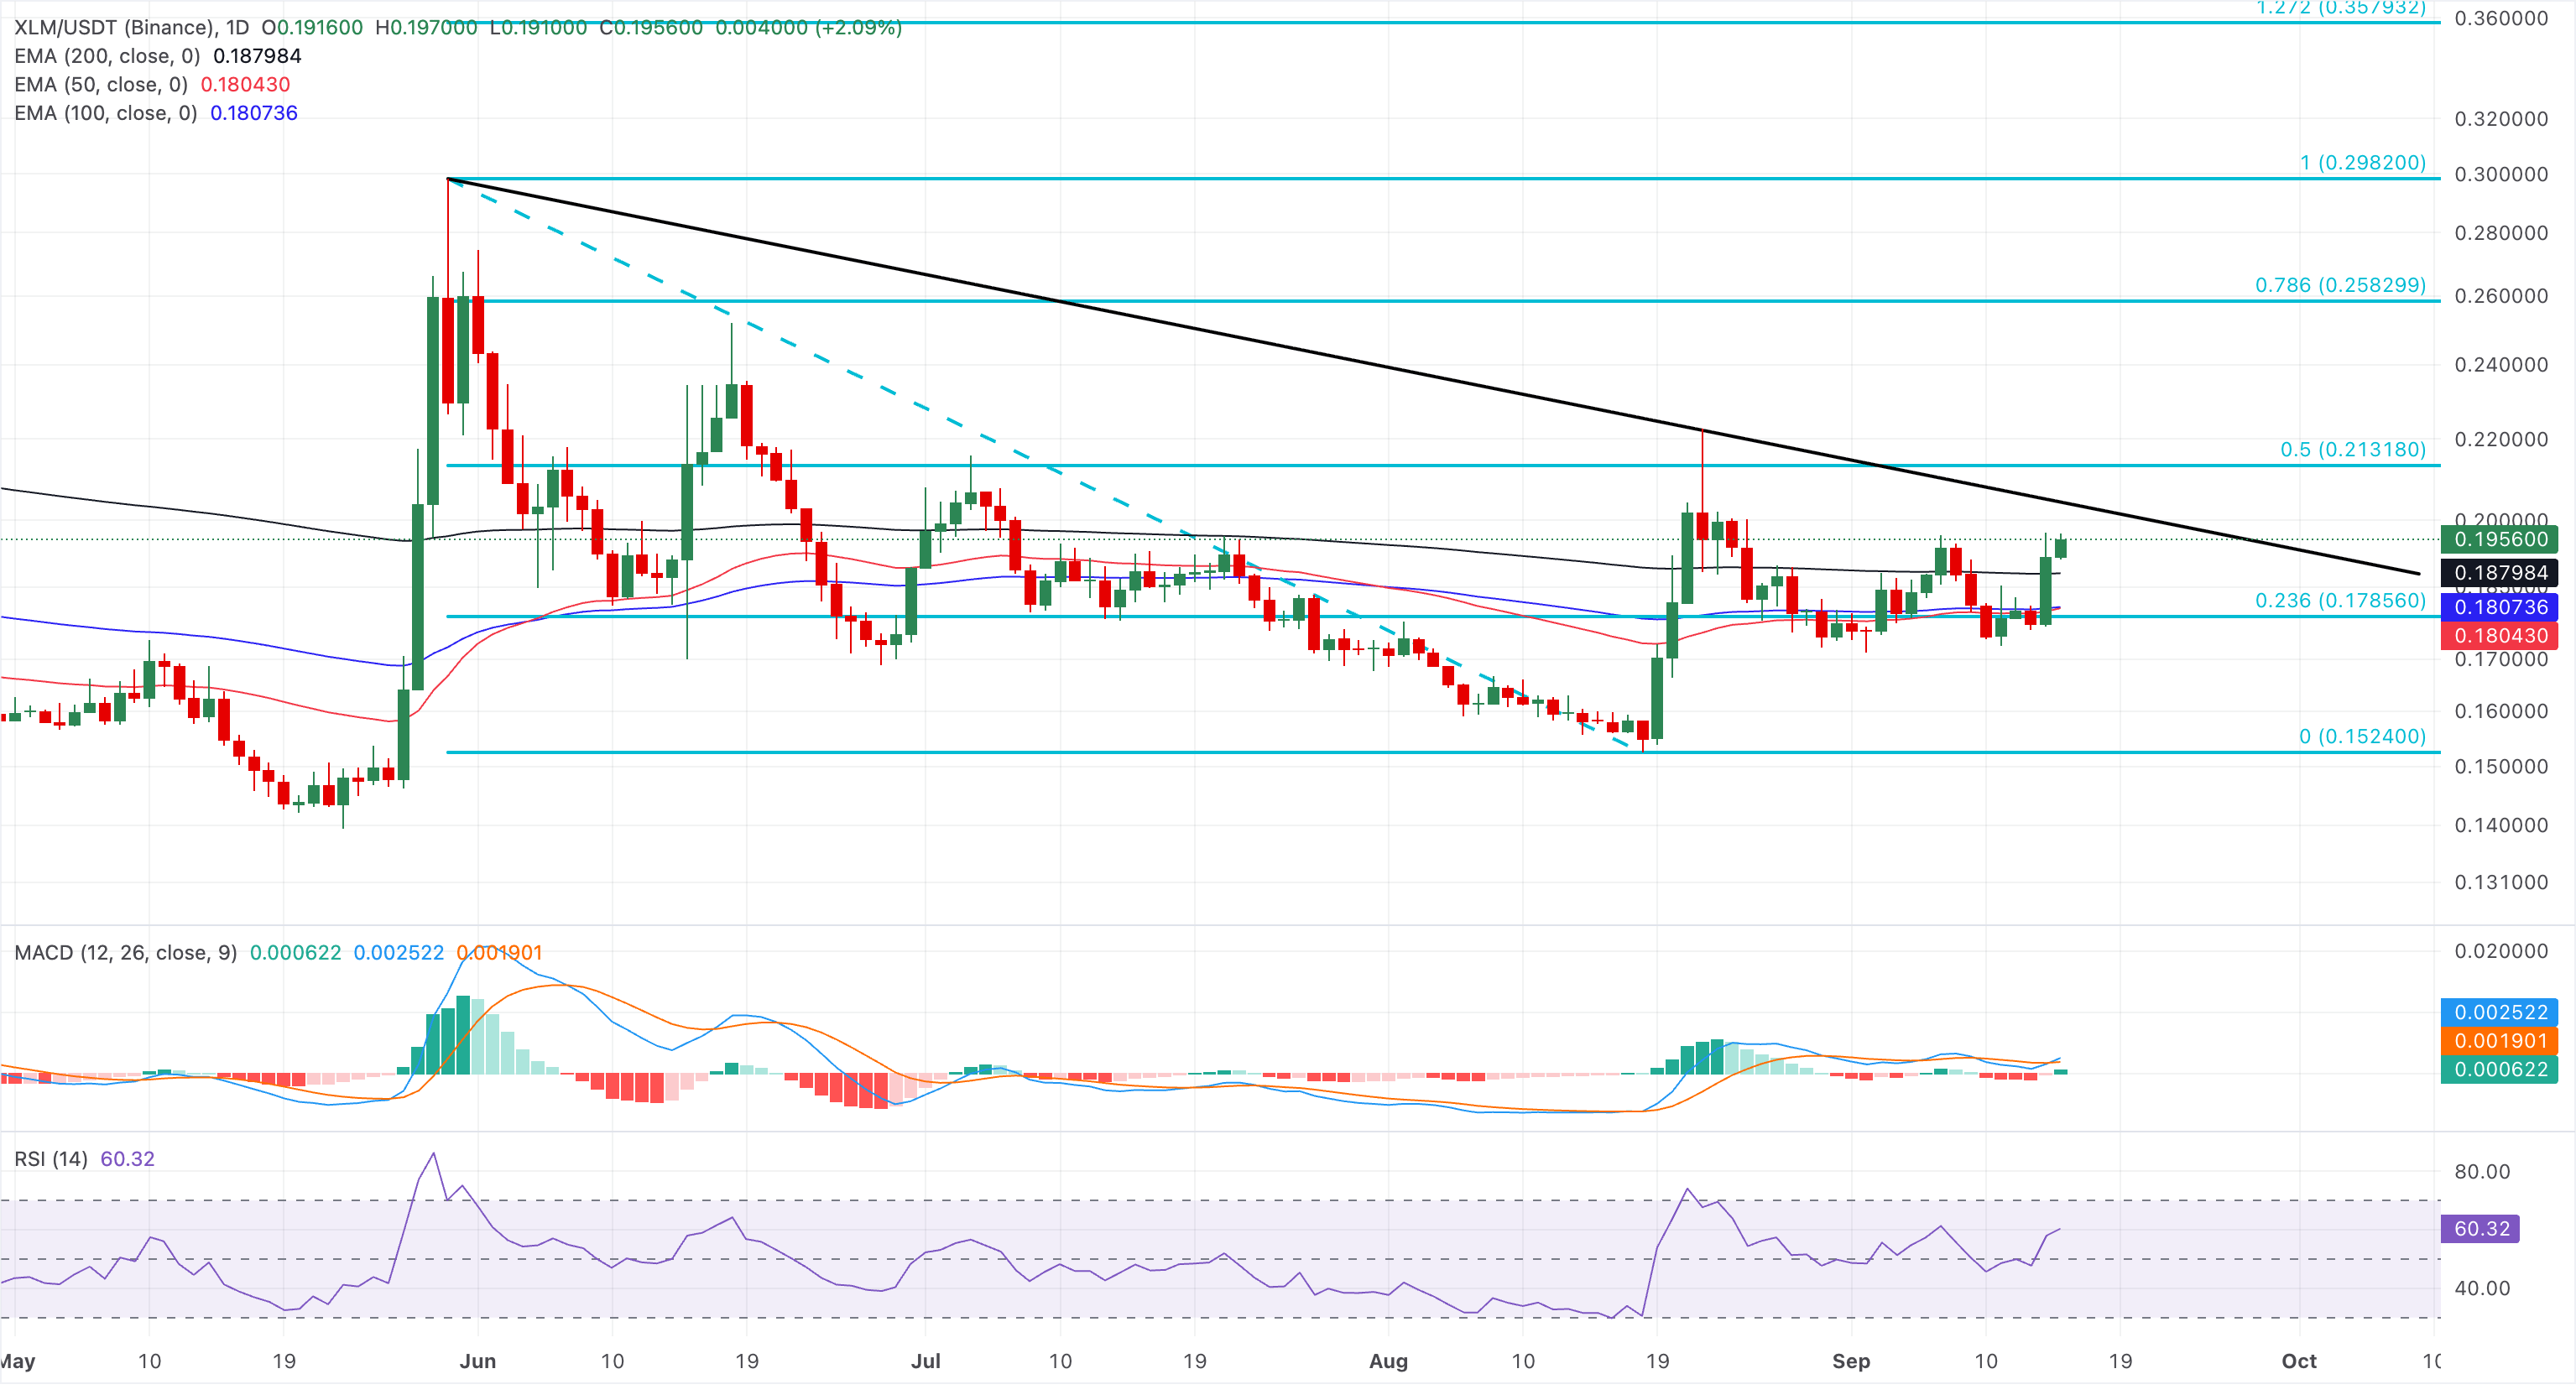
On the downside, immediate support emerges at the 200-day EMA near $0.1879, reinforced by the 100-day and 50-day EMAs at $0.1807 and $0.1804, providing a deeper cushion if a pullback unfolds.
(The technical analysis of this story was written with the help of an AI tool. Know more.)
Recommended Articles


