

Pi Network Price Forecast: PI extends consolidation as bulls eye $0.10

Source Fxstreet
  • Pi Network remains in a consolidation stage below $0.0900, amid neutral momentum.
  • Retail strength in PI holds firm in the near term despite easing social chatter.
  • The technical outlook for PI is mixed, with bulls eyeing the $0.10000 psychological barrier.

Pi Network (PI) price holds steady on Friday, maintaining a consolidating tone for three consecutive days. Mild retail strength in the PI token remains stable, with Open Interest above $9 million, while social buzz eases. PI token’s technical outlook is mixed, as bearish momentum wanes to neutral, with bulls eyeing the $0.1000 psychological level.

Demand holds steady for Pi Network

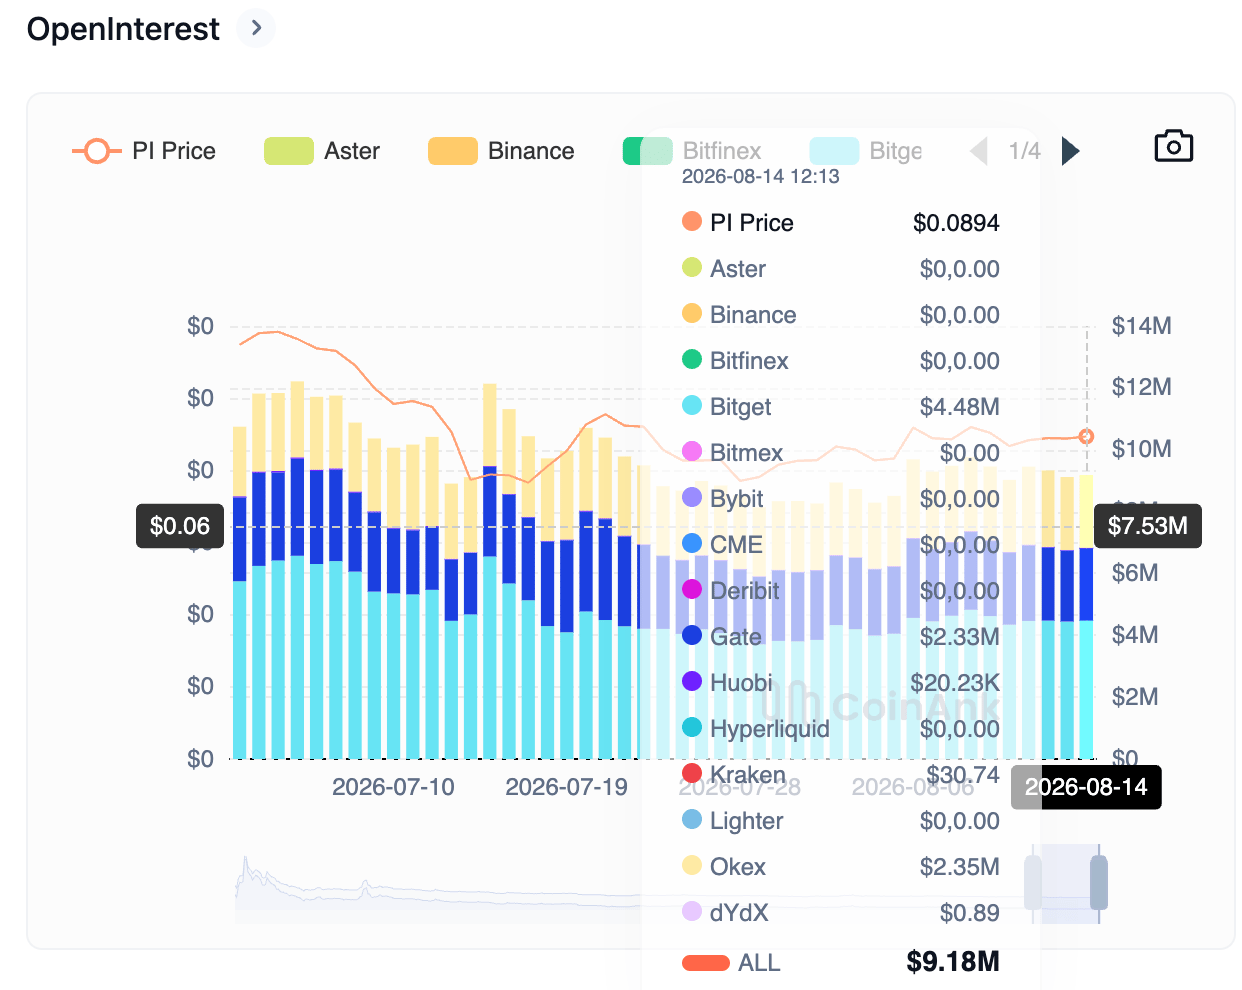
Pi Network price remains reactive to speculative demand, including positional buildup in PI futures and social chatter. On the derivative side, CoinAnk data shows a broadly stable PI Open Interest (OI) at $9.18 million, holding above $9 million so far this week. 

However, the social buzz surrounding the PI token is easing. Santiment data shows the Social Dominance and Volume are down to 0.01% and 9, respectively, from the 0.04% and 17 peak on Wednesday.
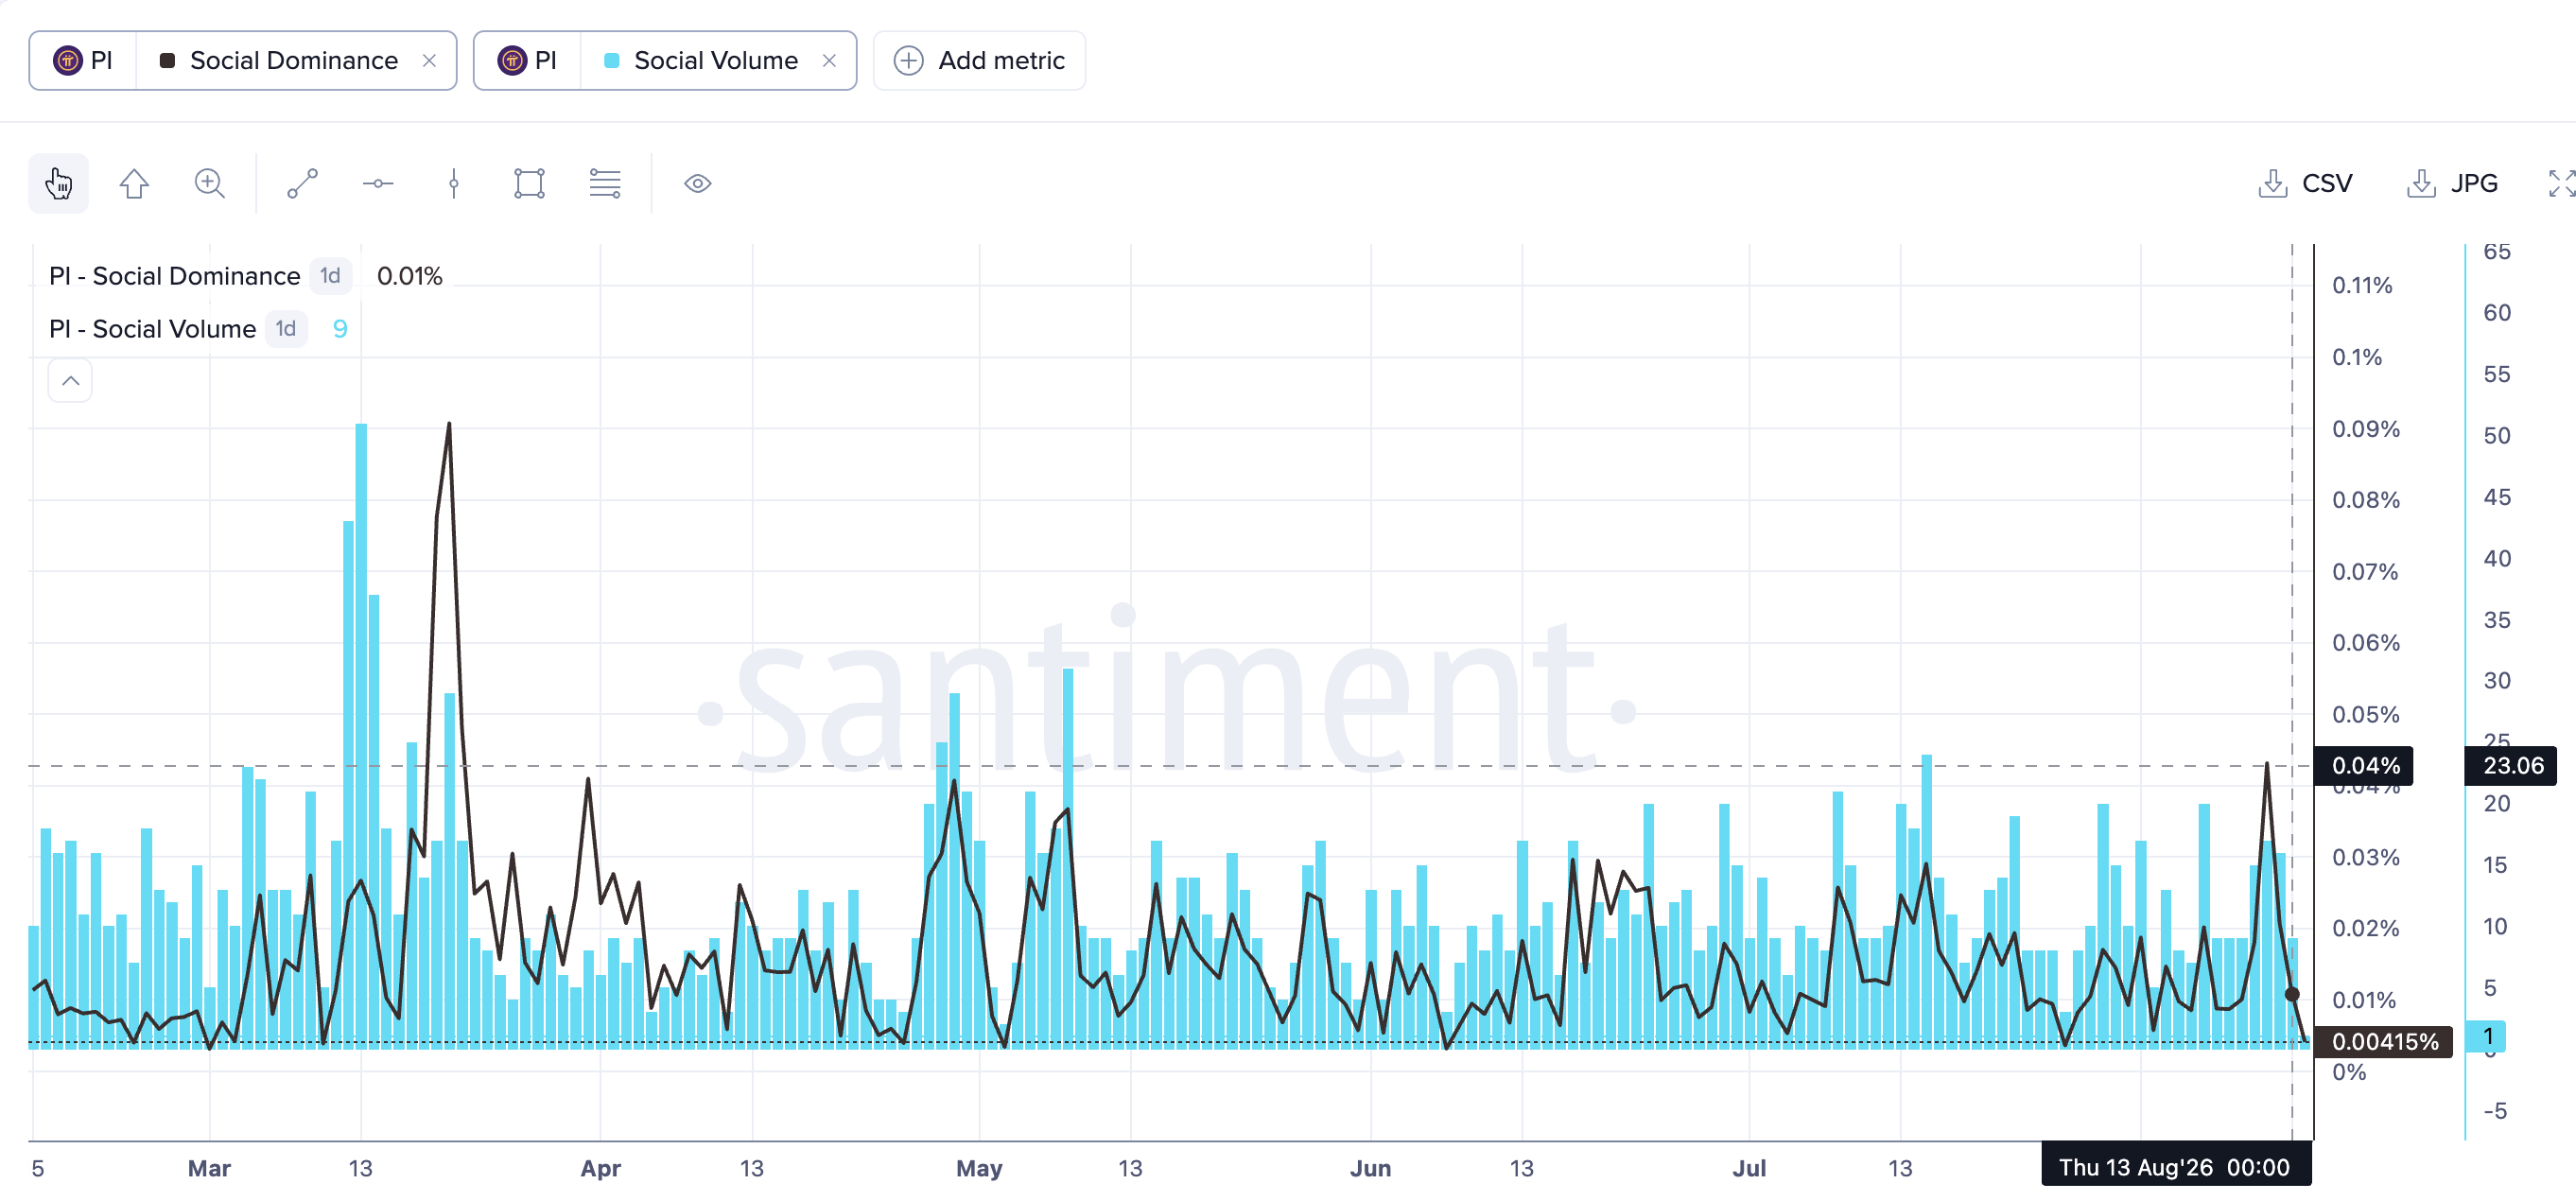
PI social interest data. Source: Santiment
PI token Open Interest chart. Source: CoinAnk

Technical outlook: Will PI token rebound?

Pi Network trades at $0.0890 on Friday, well below the broken $0.1000 psychological level, keeping the broader tone bearish despite recent stabilization. From a technical perspective, PI holds above a crucial support cluster of the broken declining trendline near $0.0800 and the 78.6% Fibonacci retracement of the downswing from $0.13410 to $0.07032, at $0.08397.

A slip below this support cluster could extend the decline to the recent swing low of $0.07032.

The Moving Average Convergence Divergence (MACD) holds an upward trend, rising toward the zero line with a modest positive histogram, while the Relative Strength Index (RSI) hovers near the neutral 50 mark, suggesting that downside pressure has paused but that bulls still need to overcome substantial overhead supply to shift the trend.
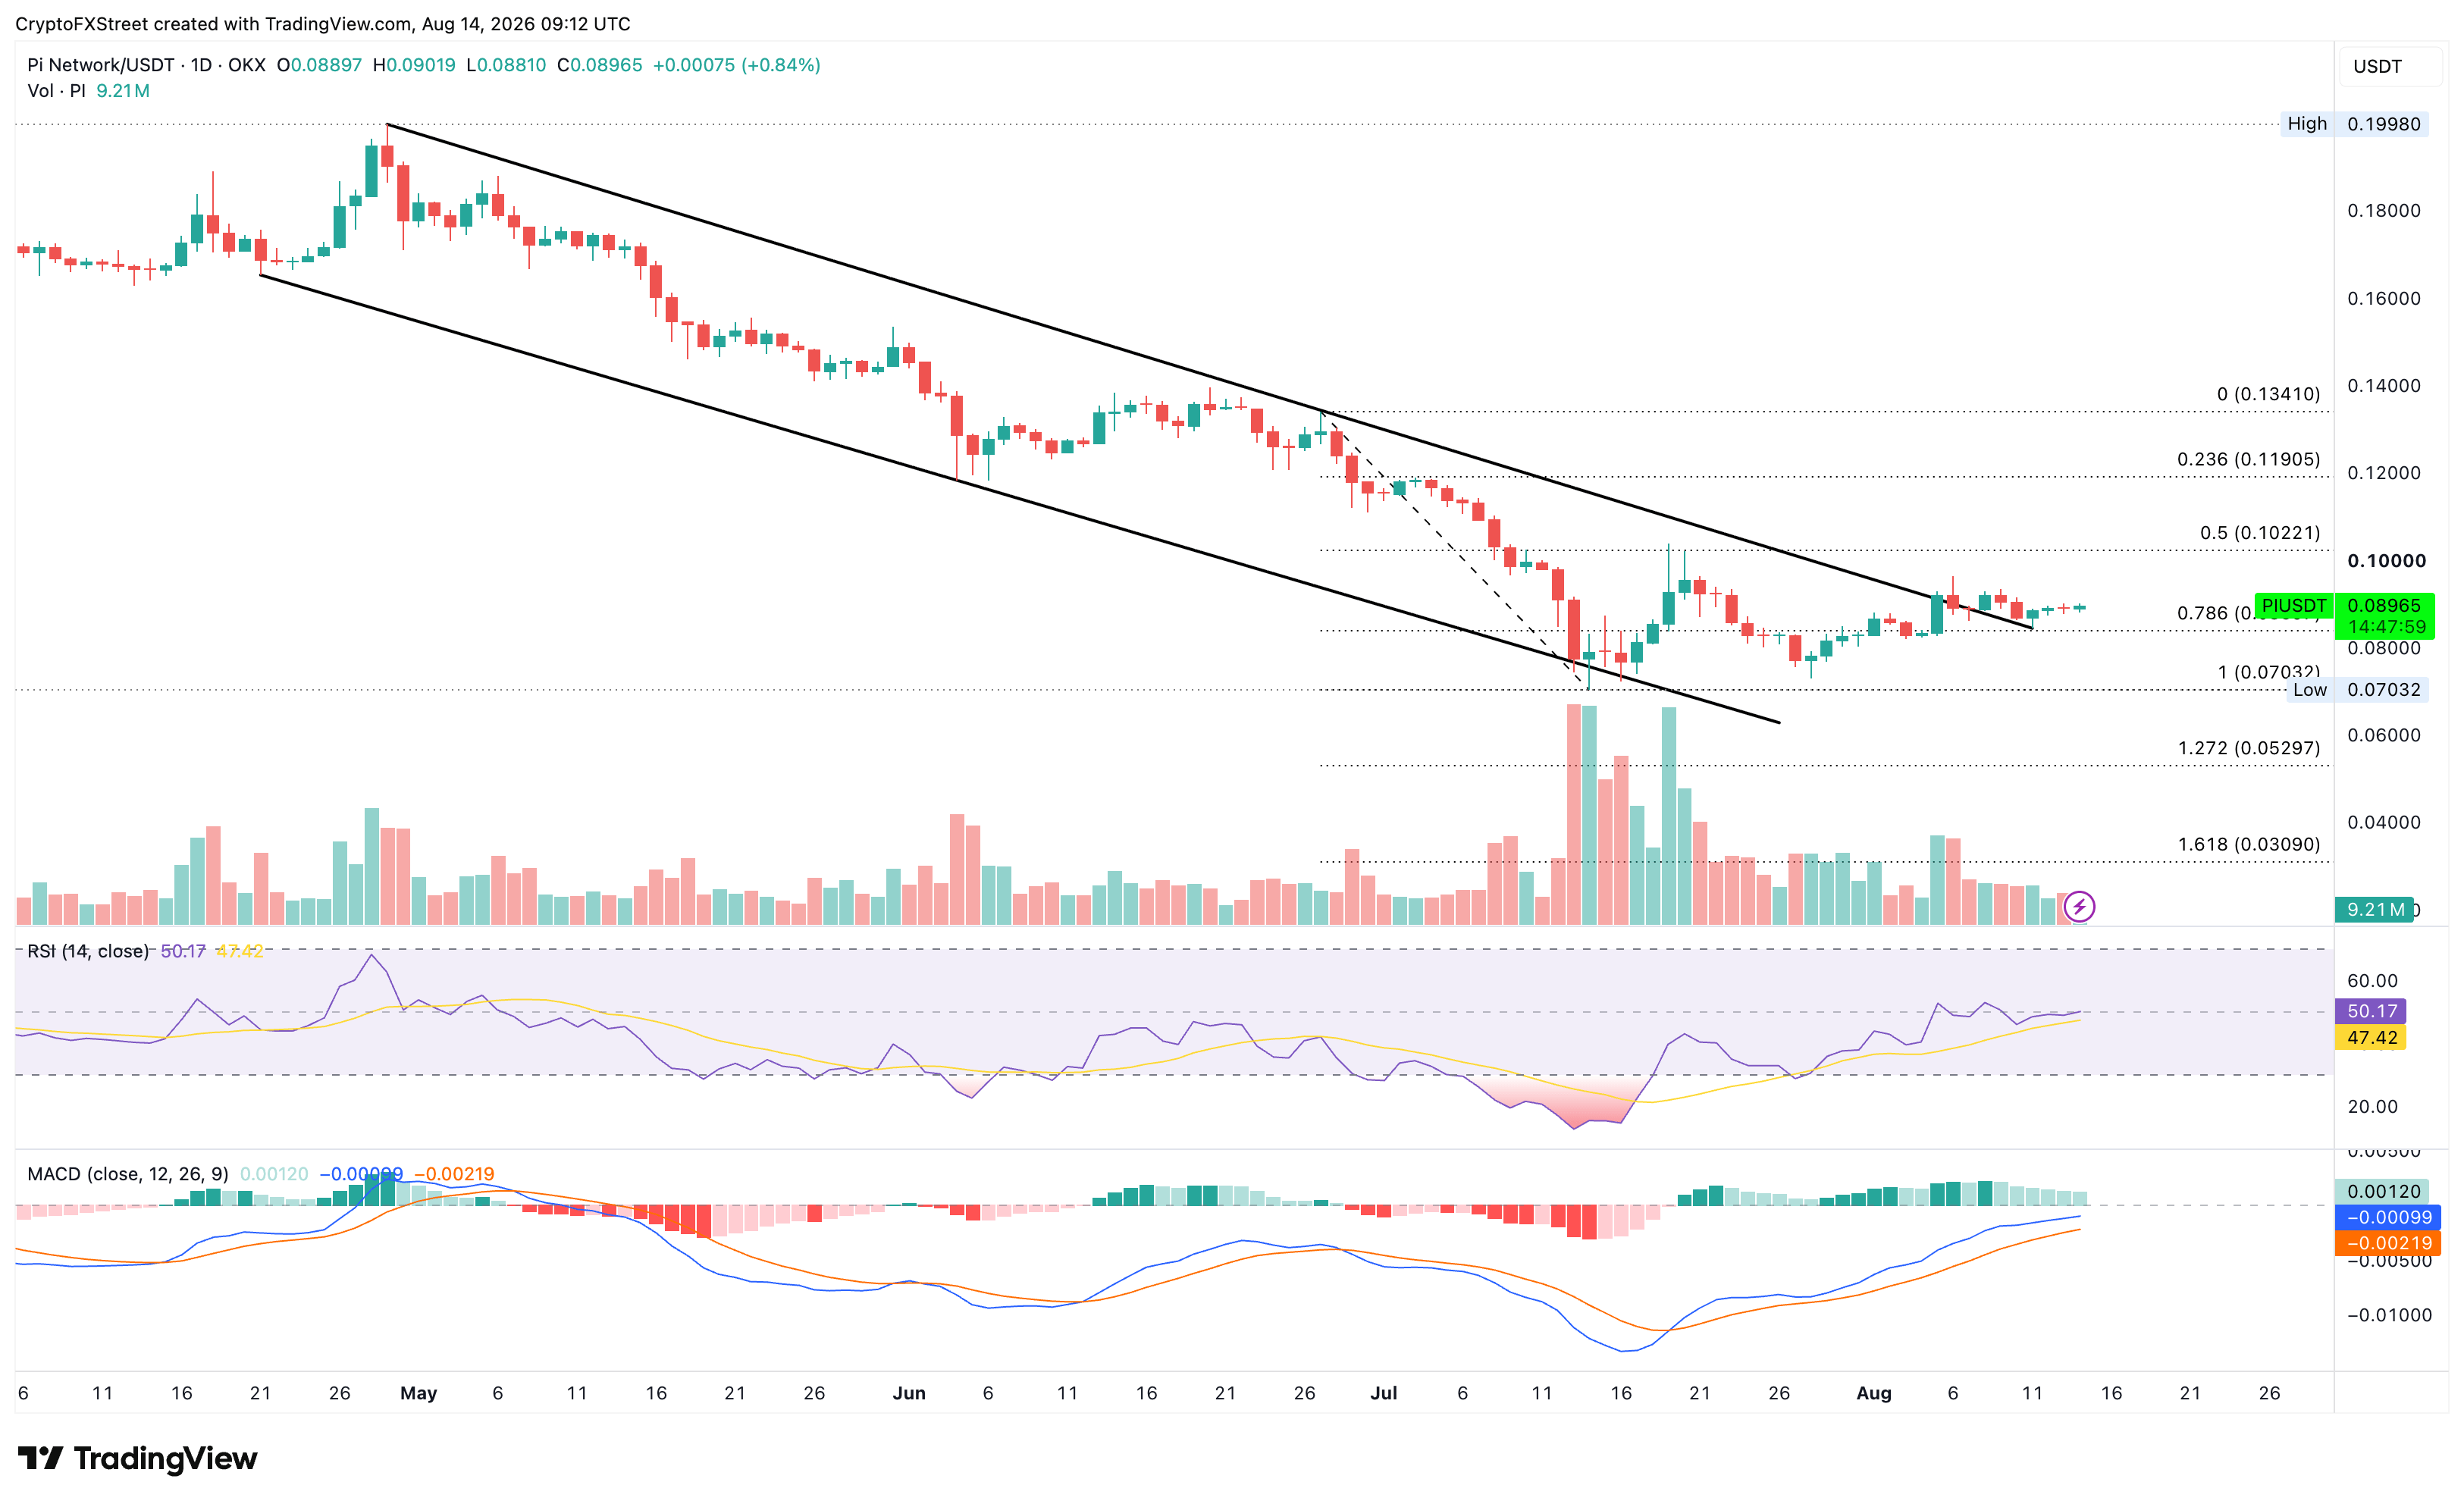
PI/USDT daily price chart.

A potential rebound in PI must clear the $0.1000 round figure and the 50% retracement at $0.10221 to reinstate a bullish trend.

(The technical analysis of this story was written with the help of an AI tool. Know more.)

Disclaimer: For information purposes only. Past performance is not indicative of future results.
placeholder
Gold Price Analysis Today: Gold Drops 1.32% Despite Lower Fed Rate-Hike Bets, Can $4,313 Support Hold? Gold fell 1.32% on August 13 after rising to $4,449.73, then reversing lower and closing near $4,349.918 below the $4,356.46 support. Softer US inflation data reduced Fed rate hike expectations, but selling pressure still dominated the session. Will $4,313 support hold?
Author  Naoufal Seddik
9 hours ago
Gold fell 1.32% on August 13 after rising to $4,449.73, then reversing lower and closing near $4,349.918 below the $4,356.46 support. Softer US inflation data reduced Fed rate hike expectations, but selling pressure still dominated the session. Will $4,313 support hold?
placeholder
XAUUSD Gold Analysis: Gold Holds Above $4,350 Ahead of US Inflation Data Is $4,500 Next? Gold holds above $4,350 following weak US jobs data. As inflation reports approach and UBS eyes $5,000, can XAUUSD break resistance at $4,435 to rally toward $4,500?
Author  Naoufal Seddik
Aug 12, Wed
Gold holds above $4,350 following weak US jobs data. As inflation reports approach and UBS eyes $5,000, can XAUUSD break resistance at $4,435 to rally toward $4,500?
placeholder
Intel Price Forecast: Nvidia Picked Xeon 6, Invested $5B, Yet Analysts Still Trail INTCIntel Corporation (NASDAQ: INTC) sits at $140.05, holding firm on the ascending trendline within the 2H timeframe. The RSI indicator is currently reading 55.21, positioning it as neutral-
Author  TradingKey
Jul 02, Thu
Intel Corporation (NASDAQ: INTC) sits at $140.05, holding firm on the ascending trendline within the 2H timeframe. The RSI indicator is currently reading 55.21, positioning it as neutral-
placeholder
NVIDIA Price Forecast: Michael Burry Shorts NVDA, but Analysts See $299On July 1, NVIDIA (NASDAQ: NVDA) sits at $198.34, failing to break above the former support level that is now serving as resistance between $198 and $205 on the 2H chart's downward blue c
Author  TradingKey
Jul 02, Thu
On July 1, NVIDIA (NASDAQ: NVDA) sits at $198.34, failing to break above the former support level that is now serving as resistance between $198 and $205 on the 2H chart's downward blue c
placeholder
Meta Compute Launch Sends AI Compute Stocks Tumbling GloballyMeta’s plan to sell surplus computing power hit chip stocks hard on Wall Street. Meta’s own shares climbed nearly 9% on the news.The announcement flipped years of assumed AI compute scarcity into a su
Author  Beincrypto
Jul 02, Thu
Meta’s plan to sell surplus computing power hit chip stocks hard on Wall Street. Meta’s own shares climbed nearly 9% on the news.The announcement flipped years of assumed AI compute scarcity into a su
goTop
quote