

Pi Network Price Forecast: Mild bearish bias caps PI corrective rebound

Source Fxstreet
  • Pi Network edges lower on Monday, after a 5% rebound last week.
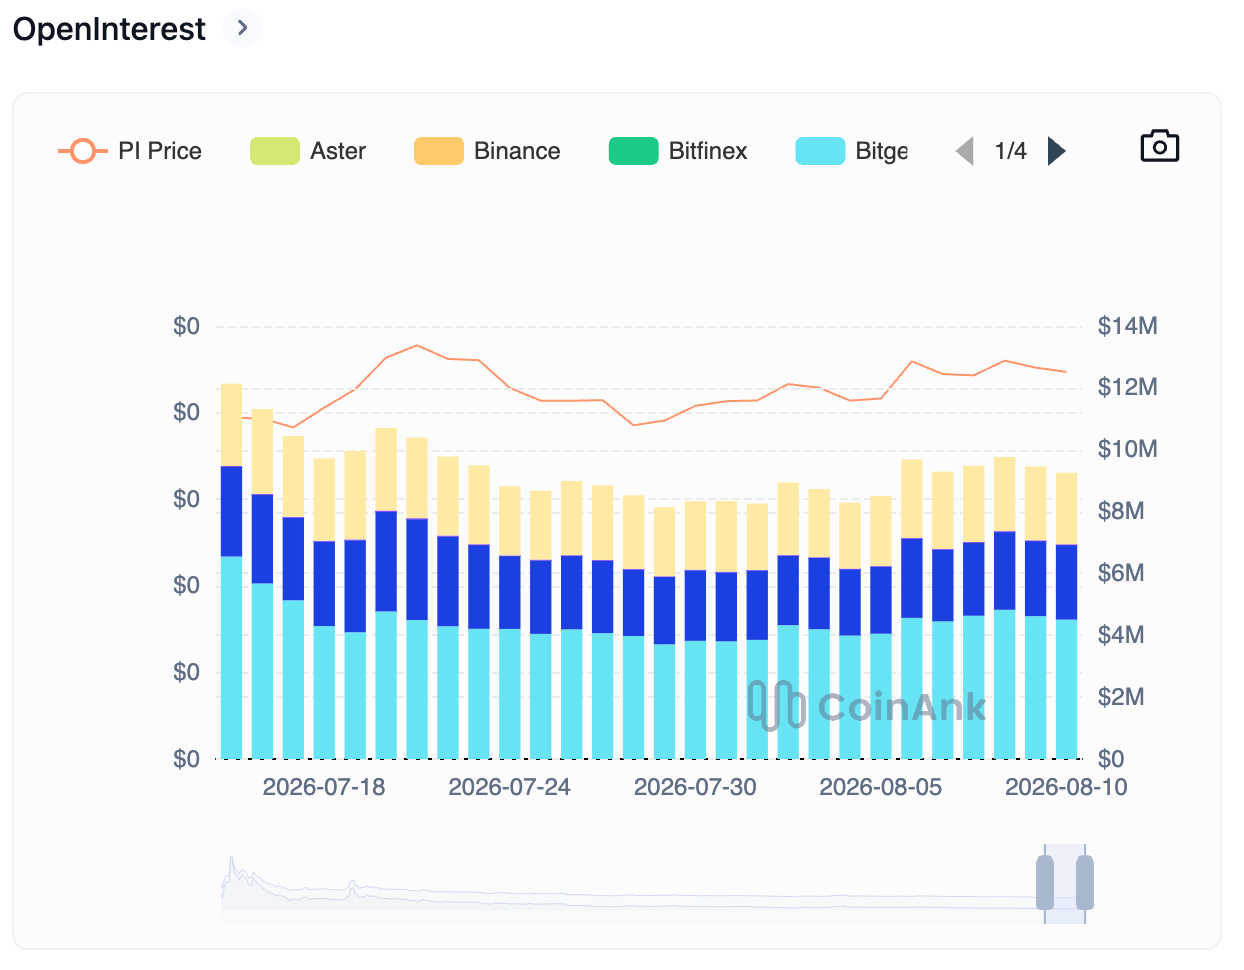
  • PI Open Interest remains above $9 million, while the Fear and Greed Index at 40 indicates a mild recovery in market sentiment.
  • The technical outlook for PI indicates a mild bearish bias as the price remains capped below $0.1000.

Pi Network (PI) extends losses Monday after a bearish close the previous day, as price remains capped below the $0.1000 psychological threshold. Speculative demand for PI is low, with Open Interest holding above $9 million as broader market sentiment improves. The technical outlook for PI indicates a mild bearish bias as the $0.0961 resistance level remains intact.

Could PI regain retail strength amid broader market recovery?

The broader cryptocurrency market shows early signs of improving risk appetite, with the Fear and Greed Index at 40 indicating a neutral shift out of the Fear zone. Meanwhile, speculative demand for Pi Network is holding steady in the near term. CoinAnk data shows the PI futures Open Interest at $9.26 million, holding above $9 million over the last six days. Taken together, the steady positional buildup amid improving broader market conditions implies a mild bullish bias.
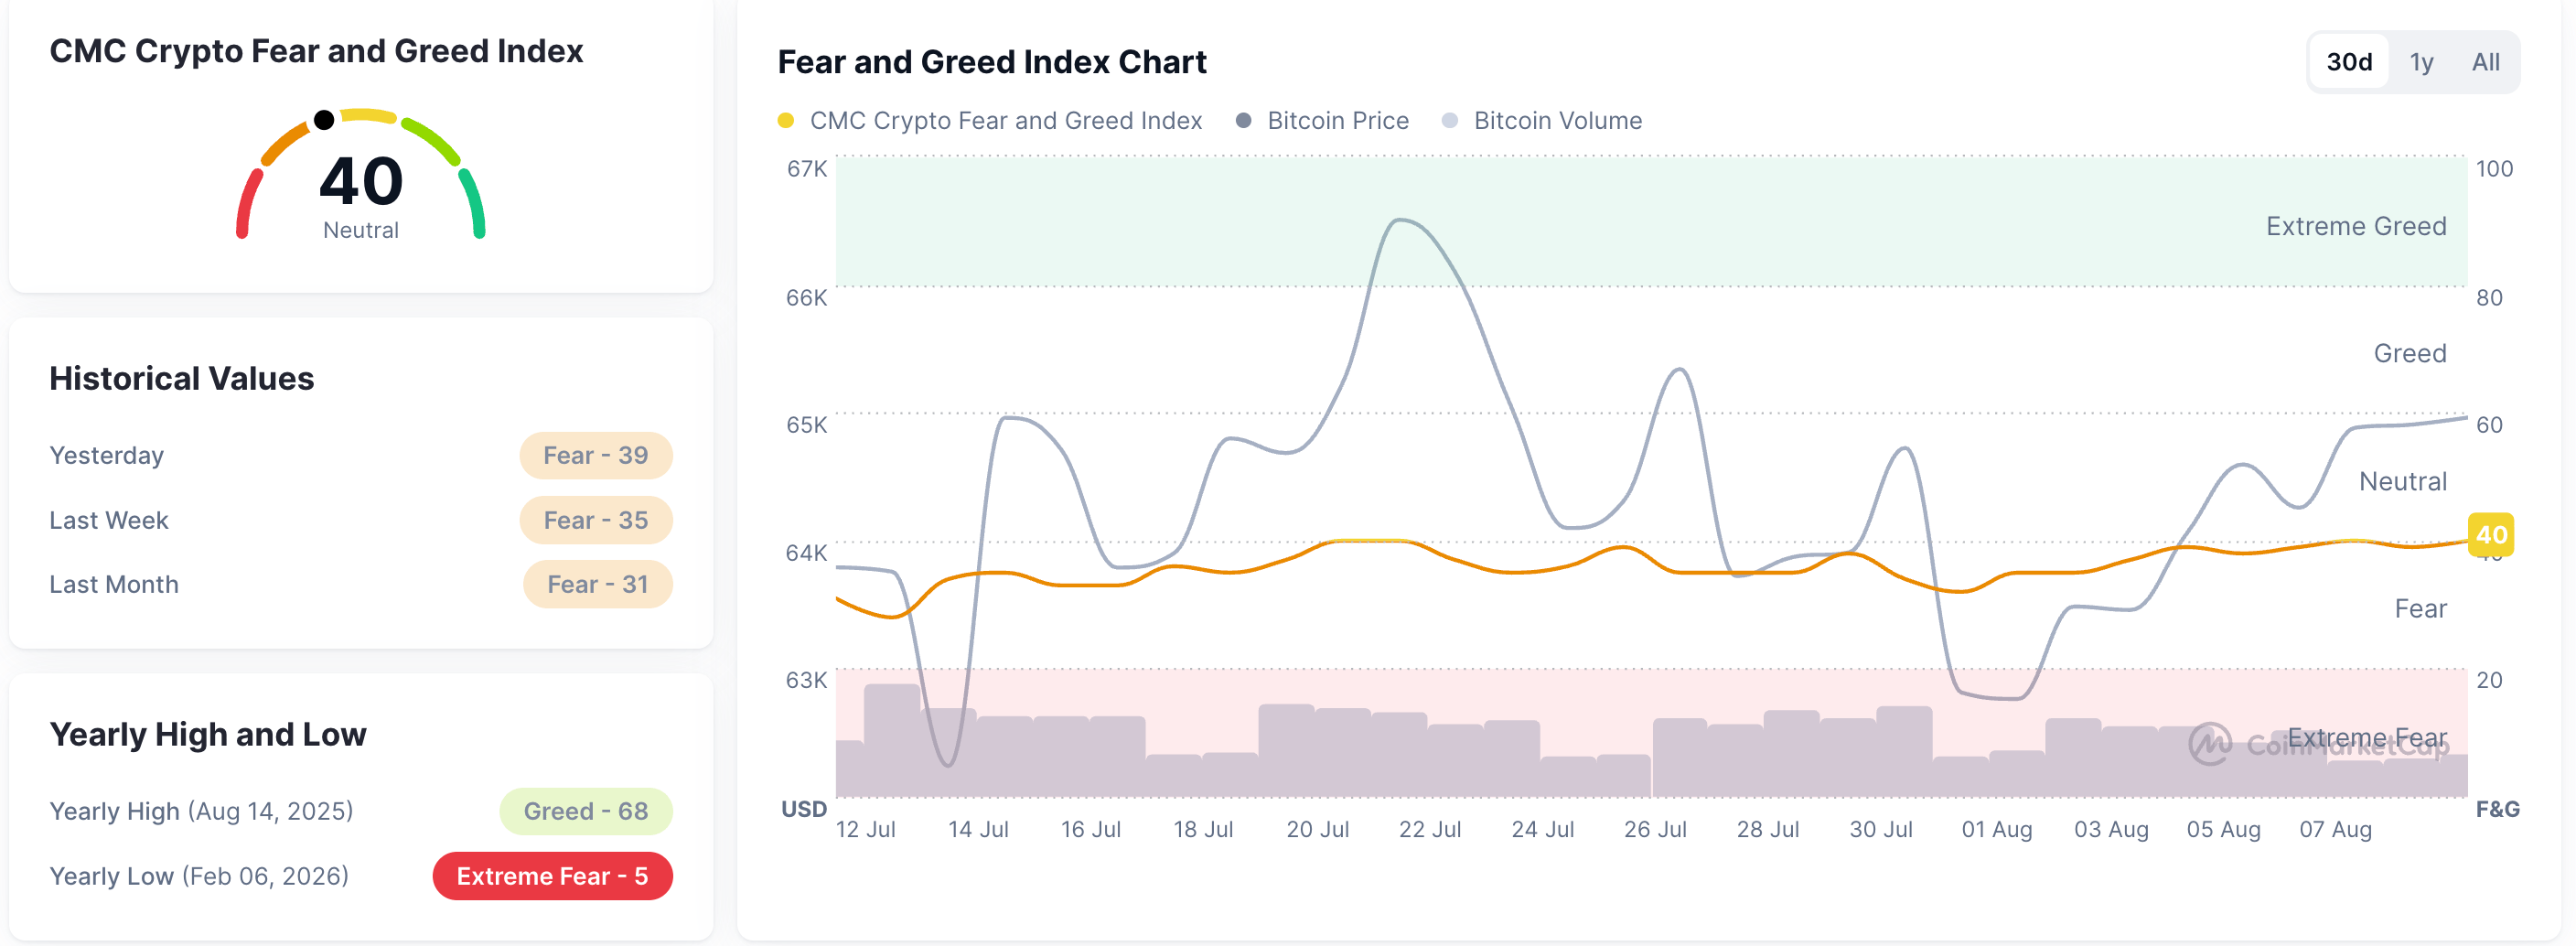
Fear and Greed Index. Source: CoinMarketCap
PI token Open Interest chart. Source: CoinAnk

Technical outlook: Will Pi Network reclaim $0.10?

Pi Network maintains a broader bearish structure as the price holds below the 127.2% Fibonacci extension level, measured from $0.1998 to $0.1183, at $0.0961. At the time of writing, PI edges lower on Monday, reaffirming the intense pressure near $0.0961.

The Moving Average Convergence Divergence (MACD) is above its signal line and rising higher in negative territory, indicating easing bearish pressure. At the same time, the Relative Strength Index (RSI) near 49 shows a steady recovery nearing the midline.

To further extend its recovery, PI should clear above $0.0961, which could open the path toward the $0.1183 Fibonacci anchor.
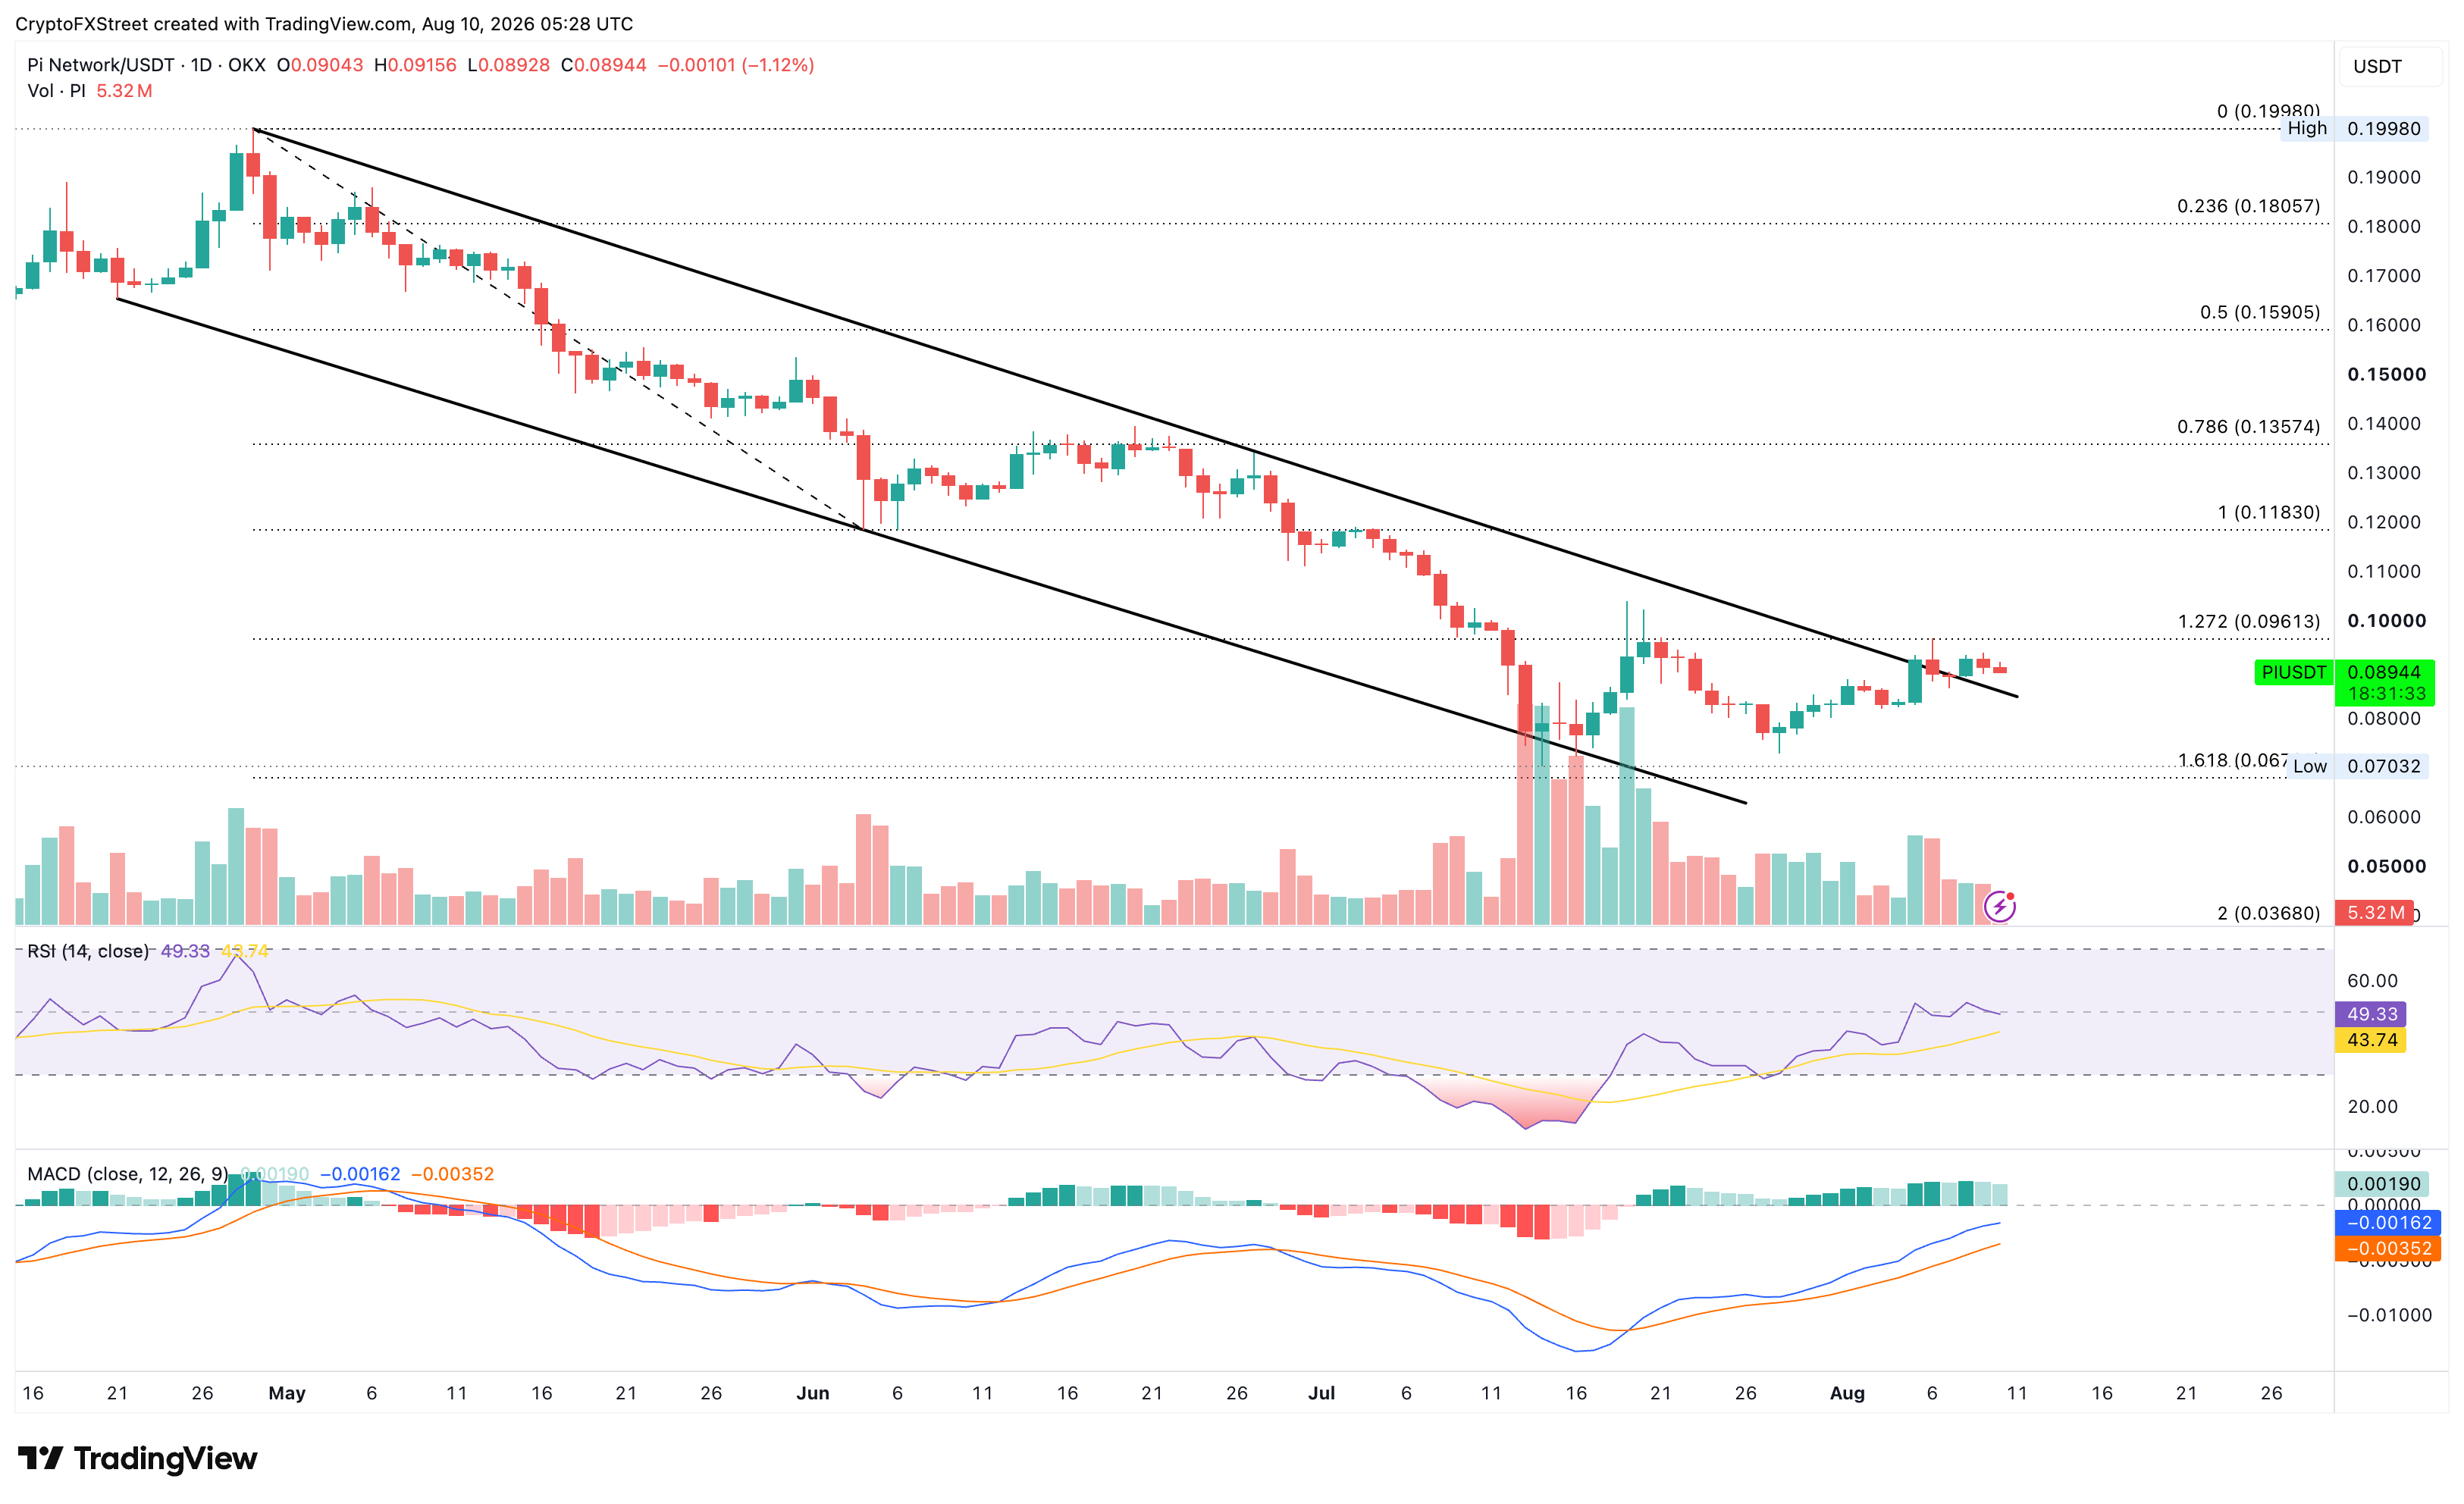
PI/USD daily price chart.

Looking down, the broken descending trendline near $0.0950 emerges as the immediate support, followed by the $0.0700 record low.

(The technical analysis of this story was written with the help of an AI tool. Know more.)

Disclaimer: For information purposes only. Past performance is not indicative of future results.
placeholder
Asian Currencies Steady Near Lows as Yen Hovering Near 160 Triggers Intervention WatchAsian markets stabilized following a sharp selloff, balanced by a fragile Middle East ceasefire and strong U.S. economic data that fueled expectations of prolonged high Federal Reserve interest rates.
Author  Mitrade Team
Jun 04, Thu
Asian markets stabilized following a sharp selloff, balanced by a fragile Middle East ceasefire and strong U.S. economic data that fueled expectations of prolonged high Federal Reserve interest rates.
placeholder
Gold Price Analysis (XAU/USD): Gold Falls to 6-Month Low as Inflation Fuels Rate Hike Bets, A Buying Opportunity or a Falling Knife? Gold hit a 6-month low on Fed rate hike bets. However, strong central bank buying and technical indicators suggest potential tactical bounces and long-term accumulation windows.
Author  Mitrade Team
Jun 12, Fri
Gold hit a 6-month low on Fed rate hike bets. However, strong central bank buying and technical indicators suggest potential tactical bounces and long-term accumulation windows.
placeholder
Japan, South Korea Stocks Rise in Early Trade; Samsung, SK Hynix Soar, SoftBank, Kioxia Track GainsTradingKey - Both the KOSPI and Nikkei 225 indexes opened higher, led by gains in Samsung Electronics and SK Hynix, with SoftBank and Kioxia following suit.During the Asian session on June 30, both Ja
Author  TradingKey
Jun 30, Tue
TradingKey - Both the KOSPI and Nikkei 225 indexes opened higher, led by gains in Samsung Electronics and SK Hynix, with SoftBank and Kioxia following suit.During the Asian session on June 30, both Ja
placeholder
XRP Price Prediction for July 2026: Can Buyers Finally Break the Downtrend?XRP (XRP) price trades near $1.05, caught between a year-long downtrend and a sudden burst of buying.July has historically rewarded XRP holders. This year the month arrives with on-chain accumulation
Author  Beincrypto
Jun 30, Tue
XRP (XRP) price trades near $1.05, caught between a year-long downtrend and a sudden burst of buying.July has historically rewarded XRP holders. This year the month arrives with on-chain accumulation
placeholder
Brent Crude Oil Erases Entire War Premium, Falls 40% to Pre-War LevelsBrent crude oil has erased its entire war premium, sliding roughly 40% from its March peak near $120 to trade around $72.25 on Wednesday. The move returns oil to its pre-war support base.The retreat f
Author  Beincrypto
Jul 02, Thu
Brent crude oil has erased its entire war premium, sliding roughly 40% from its March peak near $120 to trade around $72.25 on Wednesday. The move returns oil to its pre-war support base.The retreat f
goTop
quote