

Pi Network Price Forecast: PI risks bearish reversal from key resistance trendline

Source Fxstreet
  • Pi Network edges lower on Friday, capped below an overhead descending trendline near $0.0910.
  • Speculative demand holds firm with PI futures Open Interest above $9 million on Friday.
  • The technical outlook for PI indicates a near-term bearish bias, with risks of further decline.

Pi Network (PI) edges lower on Friday, extending the losses from the previous day. Retail demand holds firm in the near term, as PI futures Open Interest has remained above $9 million over the last three days. The technical outlook for PI highlights a downside risk as the price remains capped by an overhead trendline near $0.0910.

Pi Network holds retail demand amid market volatility

Pi Network shows steady retail support amid growing market volatility linked to the delay in the CLARITY Act vote and the lingering US-Iran tensions. CoinAnk data shows the PI futures Open Interest (OI) is at $9.21 million, holding steady above the $9 million for the third consecutive day. However, the OI fell to $9.69 million on Wednesday, indicating a mild easing in the notional value of active perpetual contracts. 
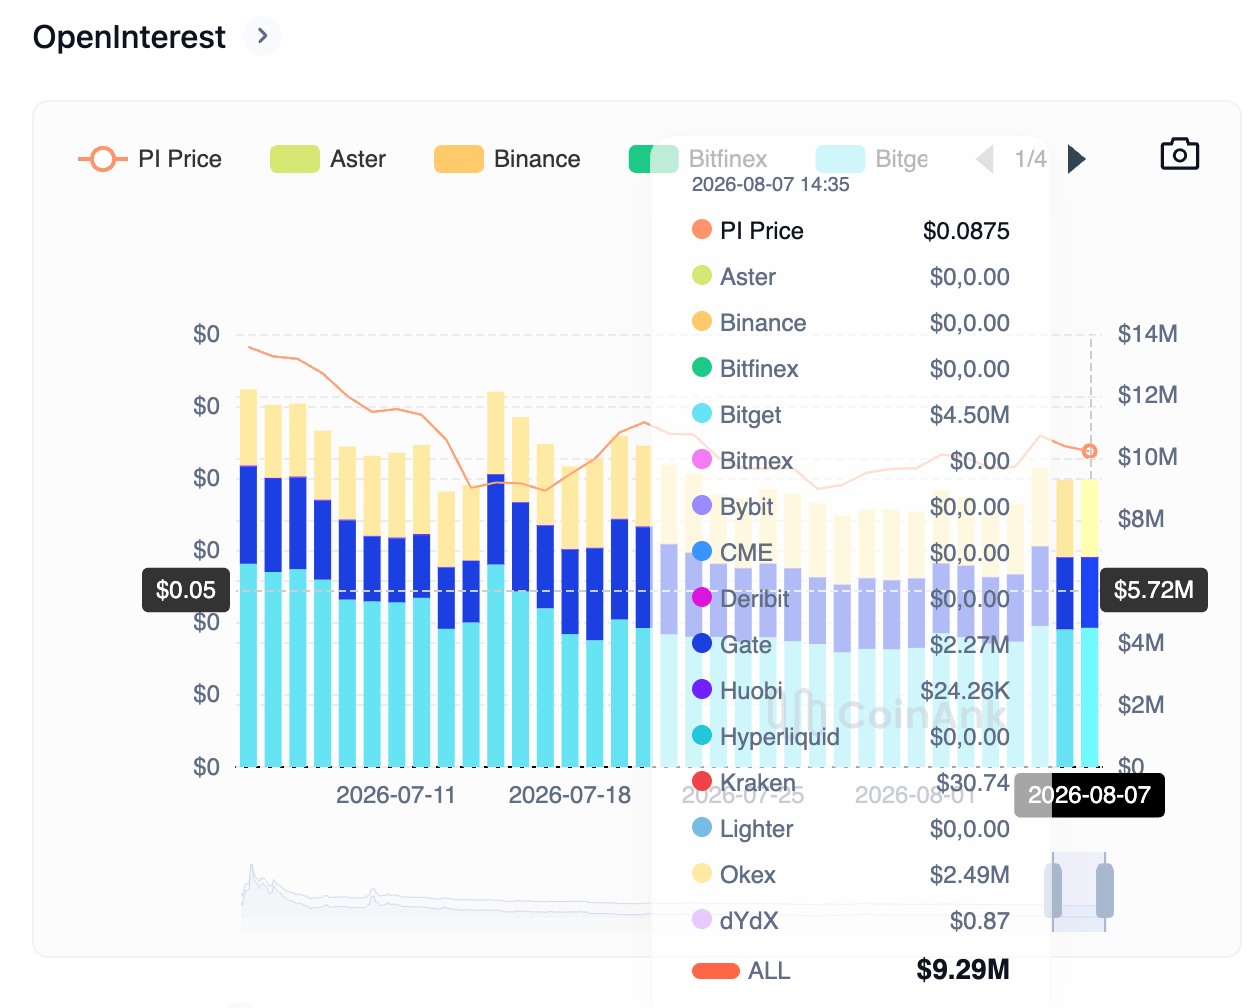
PI token Open Interest chart. Source: CoinAnk

Technical outlook: Will PI hold its gains?

Pi Network trades at $0.0871 on Friday, sustaining its gains from the late-July lows. Still, PI remains capped below an overhead resistance trendline near $0.0910, which keeps the near-term bias bearish.

Momentum remains constructive on the daily chart, with the Relative Strength Index (RSI) at 46, rising toward the midline as selling pressure eases. Meanwhile, the Moving Average Convergence Divergence (MACD) is trending upward above its signal line in negative territory, reaffirming easing selling pressure.

PI must secure a decisive close above $0.0910 and the 127.2% Fibonacci extension level, measured from $0.1998 to $0.1183, at $0.0961, to reinstate a bullish trend. In such a case, the Fibonacci anchor at $0.1183 could serve as the next crucial barrier.
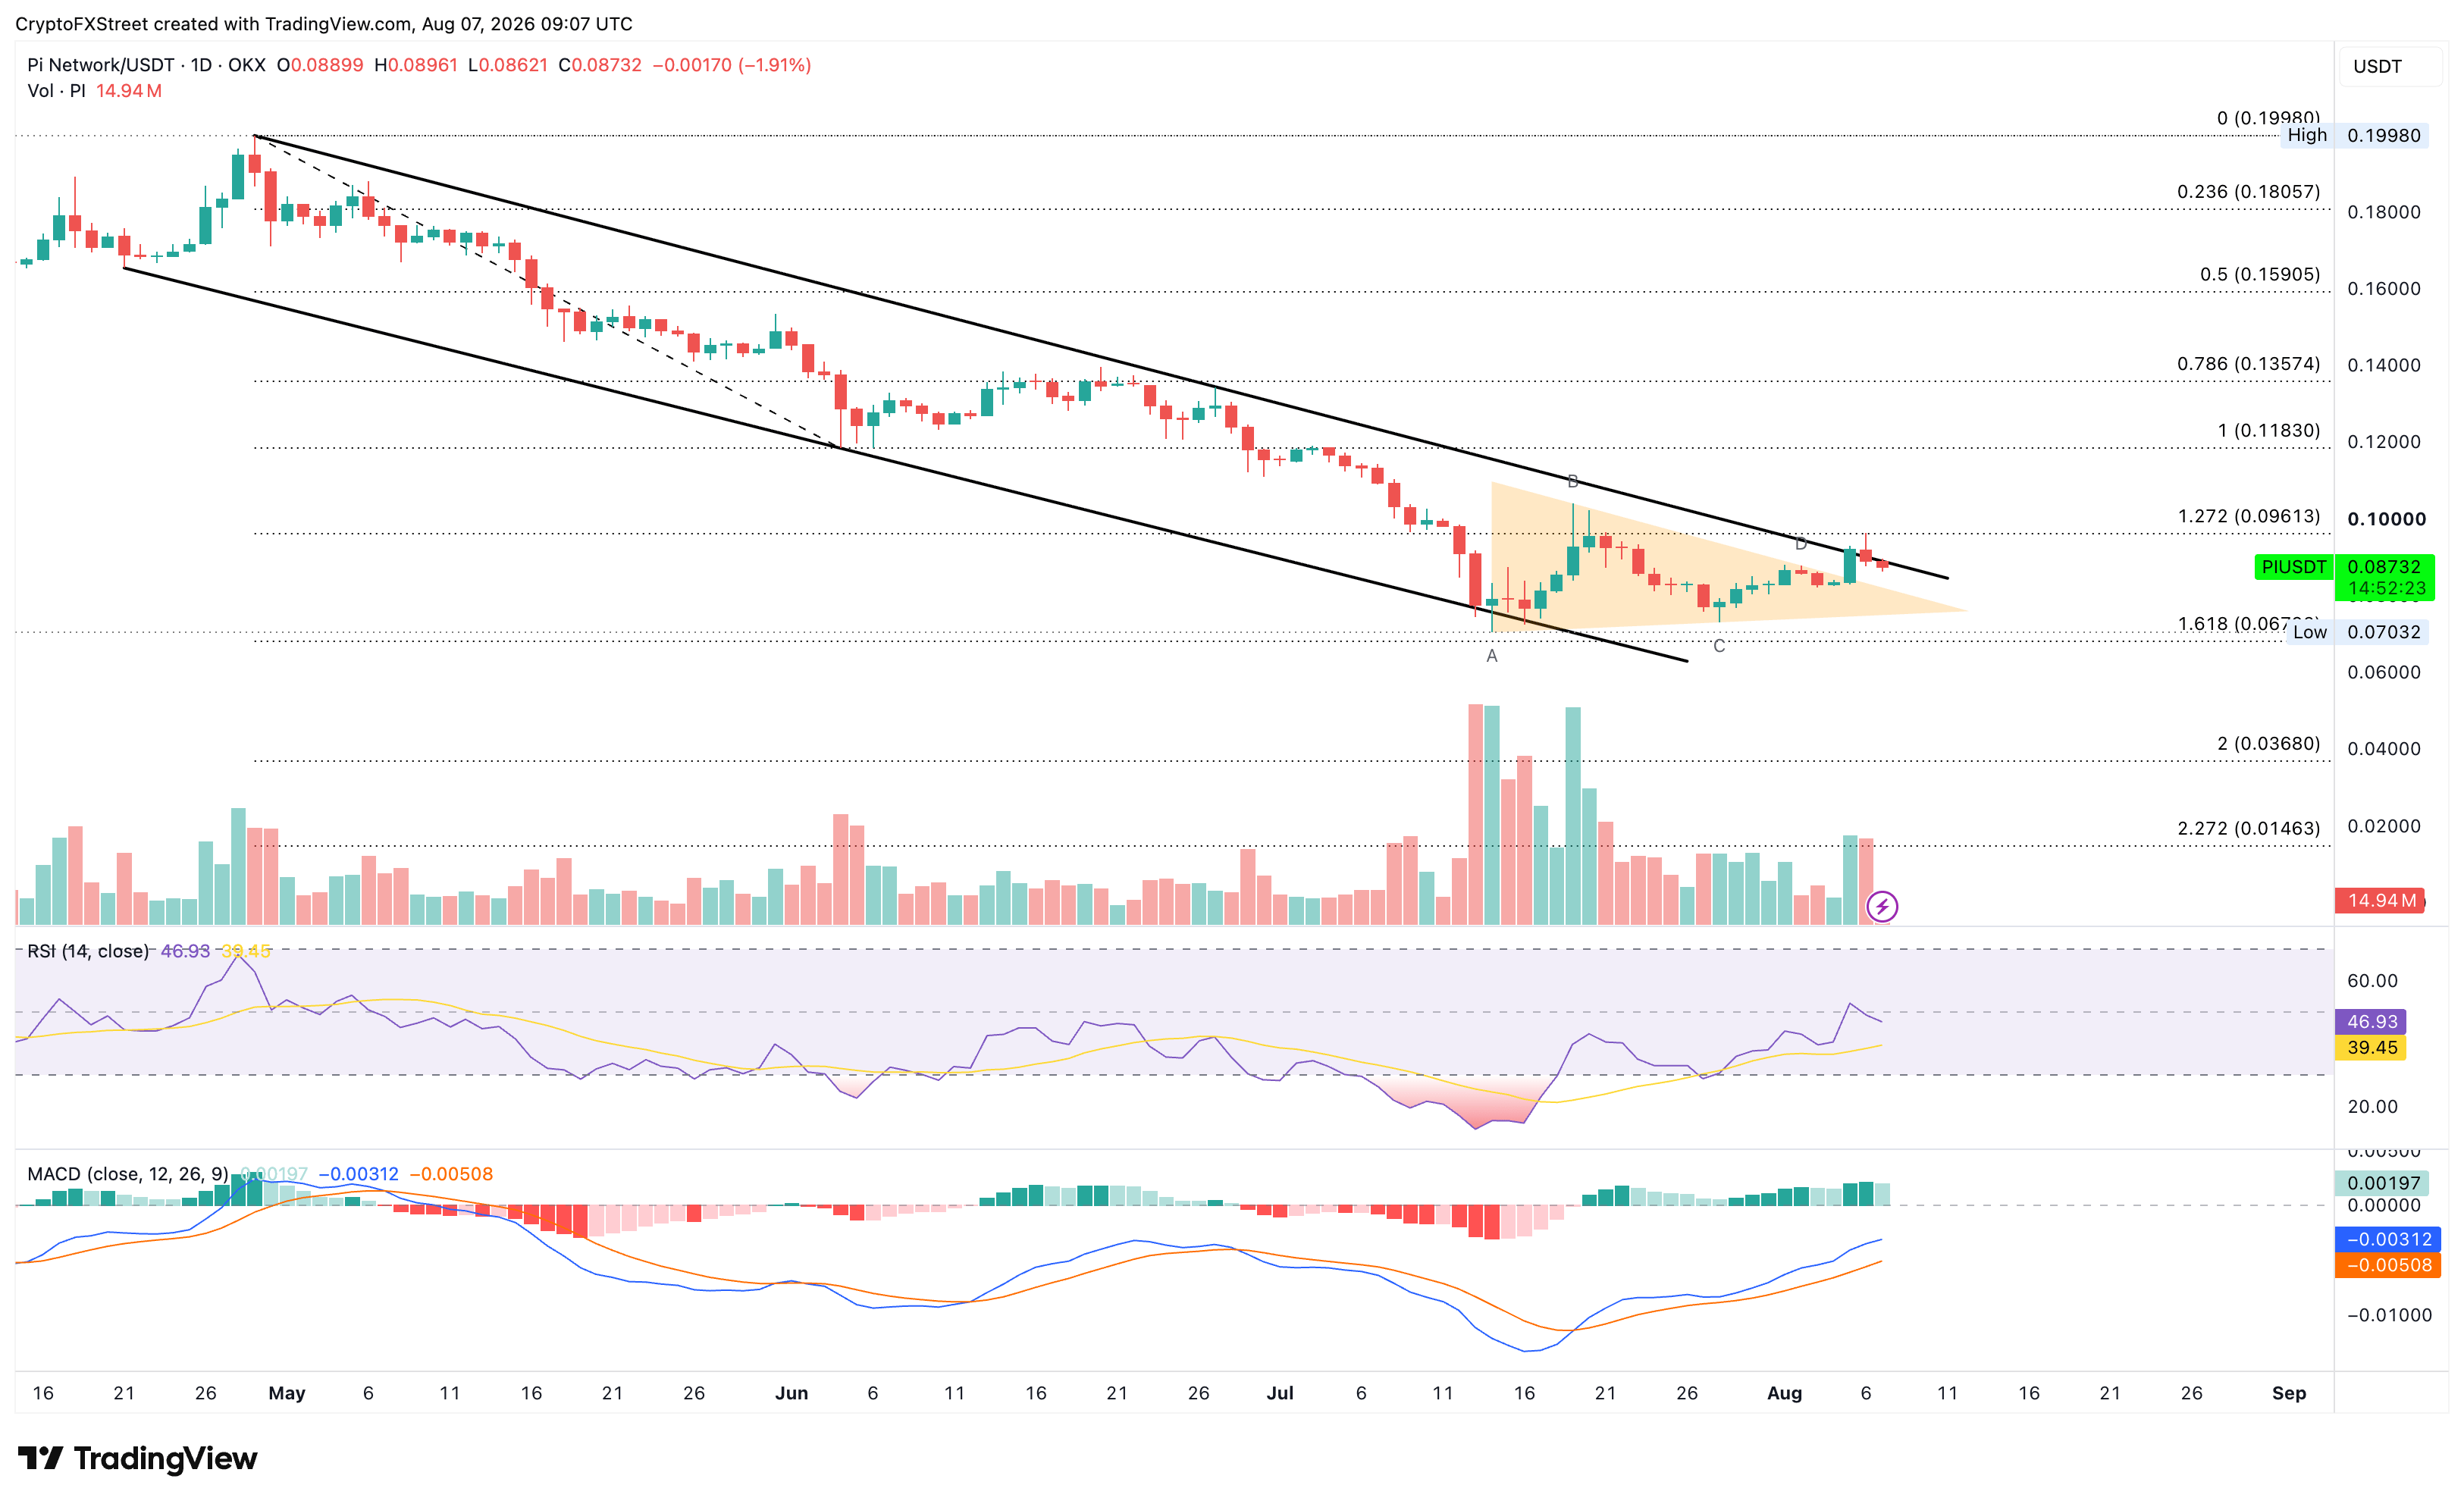
PI/USD daily price chart.

Looking down, the key support remains near its record low around $0.0700.

(The technical analysis of this story was written with the help of an AI tool. Know more.)

Disclaimer: For information purposes only. Past performance is not indicative of future results.
placeholder
Japan, South Korea Stocks Rise in Early Trade; Samsung, SK Hynix Soar, SoftBank, Kioxia Track GainsTradingKey - Both the KOSPI and Nikkei 225 indexes opened higher, led by gains in Samsung Electronics and SK Hynix, with SoftBank and Kioxia following suit.During the Asian session on June 30, both Ja
Author  TradingKey
Jun 30, Tue
TradingKey - Both the KOSPI and Nikkei 225 indexes opened higher, led by gains in Samsung Electronics and SK Hynix, with SoftBank and Kioxia following suit.During the Asian session on June 30, both Ja
placeholder
XRP Price Prediction for July 2026: Can Buyers Finally Break the Downtrend?XRP (XRP) price trades near $1.05, caught between a year-long downtrend and a sudden burst of buying.July has historically rewarded XRP holders. This year the month arrives with on-chain accumulation
Author  Beincrypto
Jun 30, Tue
XRP (XRP) price trades near $1.05, caught between a year-long downtrend and a sudden burst of buying.July has historically rewarded XRP holders. This year the month arrives with on-chain accumulation
placeholder
Gold Price Forecast: Iran Denies Trump Negotiation Plan, Gold Price May Fall to $3,500TradingKey - As of today's (July 1st) Asian morning session, gold ( XAUUSD) prices maintained a weak intraday decline. After stabilizing above $4,000 at yesterday's close, the gold price broke below $
Author  TradingKey
Jul 01, Wed
TradingKey - As of today's (July 1st) Asian morning session, gold ( XAUUSD) prices maintained a weak intraday decline. After stabilizing above $4,000 at yesterday's close, the gold price broke below $
placeholder
NVIDIA Price Forecast: Michael Burry Shorts NVDA, but Analysts See $299On July 1, NVIDIA (NASDAQ: NVDA) sits at $198.34, failing to break above the former support level that is now serving as resistance between $198 and $205 on the 2H chart's downward blue c
Author  TradingKey
Jul 02, Thu
On July 1, NVIDIA (NASDAQ: NVDA) sits at $198.34, failing to break above the former support level that is now serving as resistance between $198 and $205 on the 2H chart's downward blue c
placeholder
Brent Crude Oil Erases Entire War Premium, Falls 40% to Pre-War LevelsBrent crude oil has erased its entire war premium, sliding roughly 40% from its March peak near $120 to trade around $72.25 on Wednesday. The move returns oil to its pre-war support base.The retreat f
Author  Beincrypto
Jul 02, Thu
Brent crude oil has erased its entire war premium, sliding roughly 40% from its March peak near $120 to trade around $72.25 on Wednesday. The move returns oil to its pre-war support base.The retreat f
goTop
quote