


Crypto Overview: US Senate delays Clarity Act vote – Cardano and LayerZero sustain gains
- Bitcoin holds above $64,000 on Friday, capped by its 50-day EMA at $64,637.
- The US Senate pushed the floor vote for the Crypto Clarity Act to next month after the summer recess.
- Cardano and LayerZero emerge as top performers over the last 24 hours, sustaining gains from the previous day.
Bitcoin (BTC) price holds steady above $64,000 on Friday, with the 50-day Exponential Moving Average (EMA) at $64,637 capping gains. The US Senate has delayed the floor vote for the Crypto Clarity Act after the summer recess, starting Monday. Cardano (ADA) and LayerZero (ZRO) hold gains from the previous day's rebound, outperforming top altcoins over the last 24 hours.
Clarity Act floor vote delayed to September
Senate Majority Leader John Thune confirmed the chamber’s decision to delay the floor vote on the Crypto Clarity Act until next month, following the start of the summer recess on Monday. The Senate is expected back in Washington around September 14, when a potential floor test would need 60 votes to invoke cloture.
Technical outlook: Will BTC price cross above $65,000?
Bitcoin maintains a bearish near-term bias as its price holds below the 50-day EMA at $64,637 and remains well below the 100-day EMA at $66,977 and the 200-day EMA at $72,419.
The Moving Average Convergence Divergence (MACD) is marginally below its signal line, hinting at waning downside momentum, while the Relative Strength Index (RSI) near 51 suggests a broadly neutral tone rather than a decisive directional push.
On the topside, immediate resistance is seen at the 50-day EMA at $64,637, followed by a more significant barrier at the 100-day EMA near $66,977.
On the downside, the July 6 low at $61,307 and the recent swing low at $57,800 serve as two crucial support levels.
Technical outlook: Cardano and LayerZero eye further gains
Cardano extends its advance above the 50-day EMA at $0.1780 and the 100-day EMA at $0.1970, maintaining a constructive bullish bias. From a technical perspective, the recent recovery in ADA price forms a rising channel pattern.
Momentum is strong, as the MACD and signal line rise in the positive territory, while the RSI hovers near 68, hinting at rising buying pressure.
An overhead trendline near $0.2150, reinforced by the February 6 low at $0.2205, serves as the next notable resistance. A sustained break above this barrier would further strengthen the bullish outlook, potentially targeting the longer-term 200-day EMA at $0.2578.
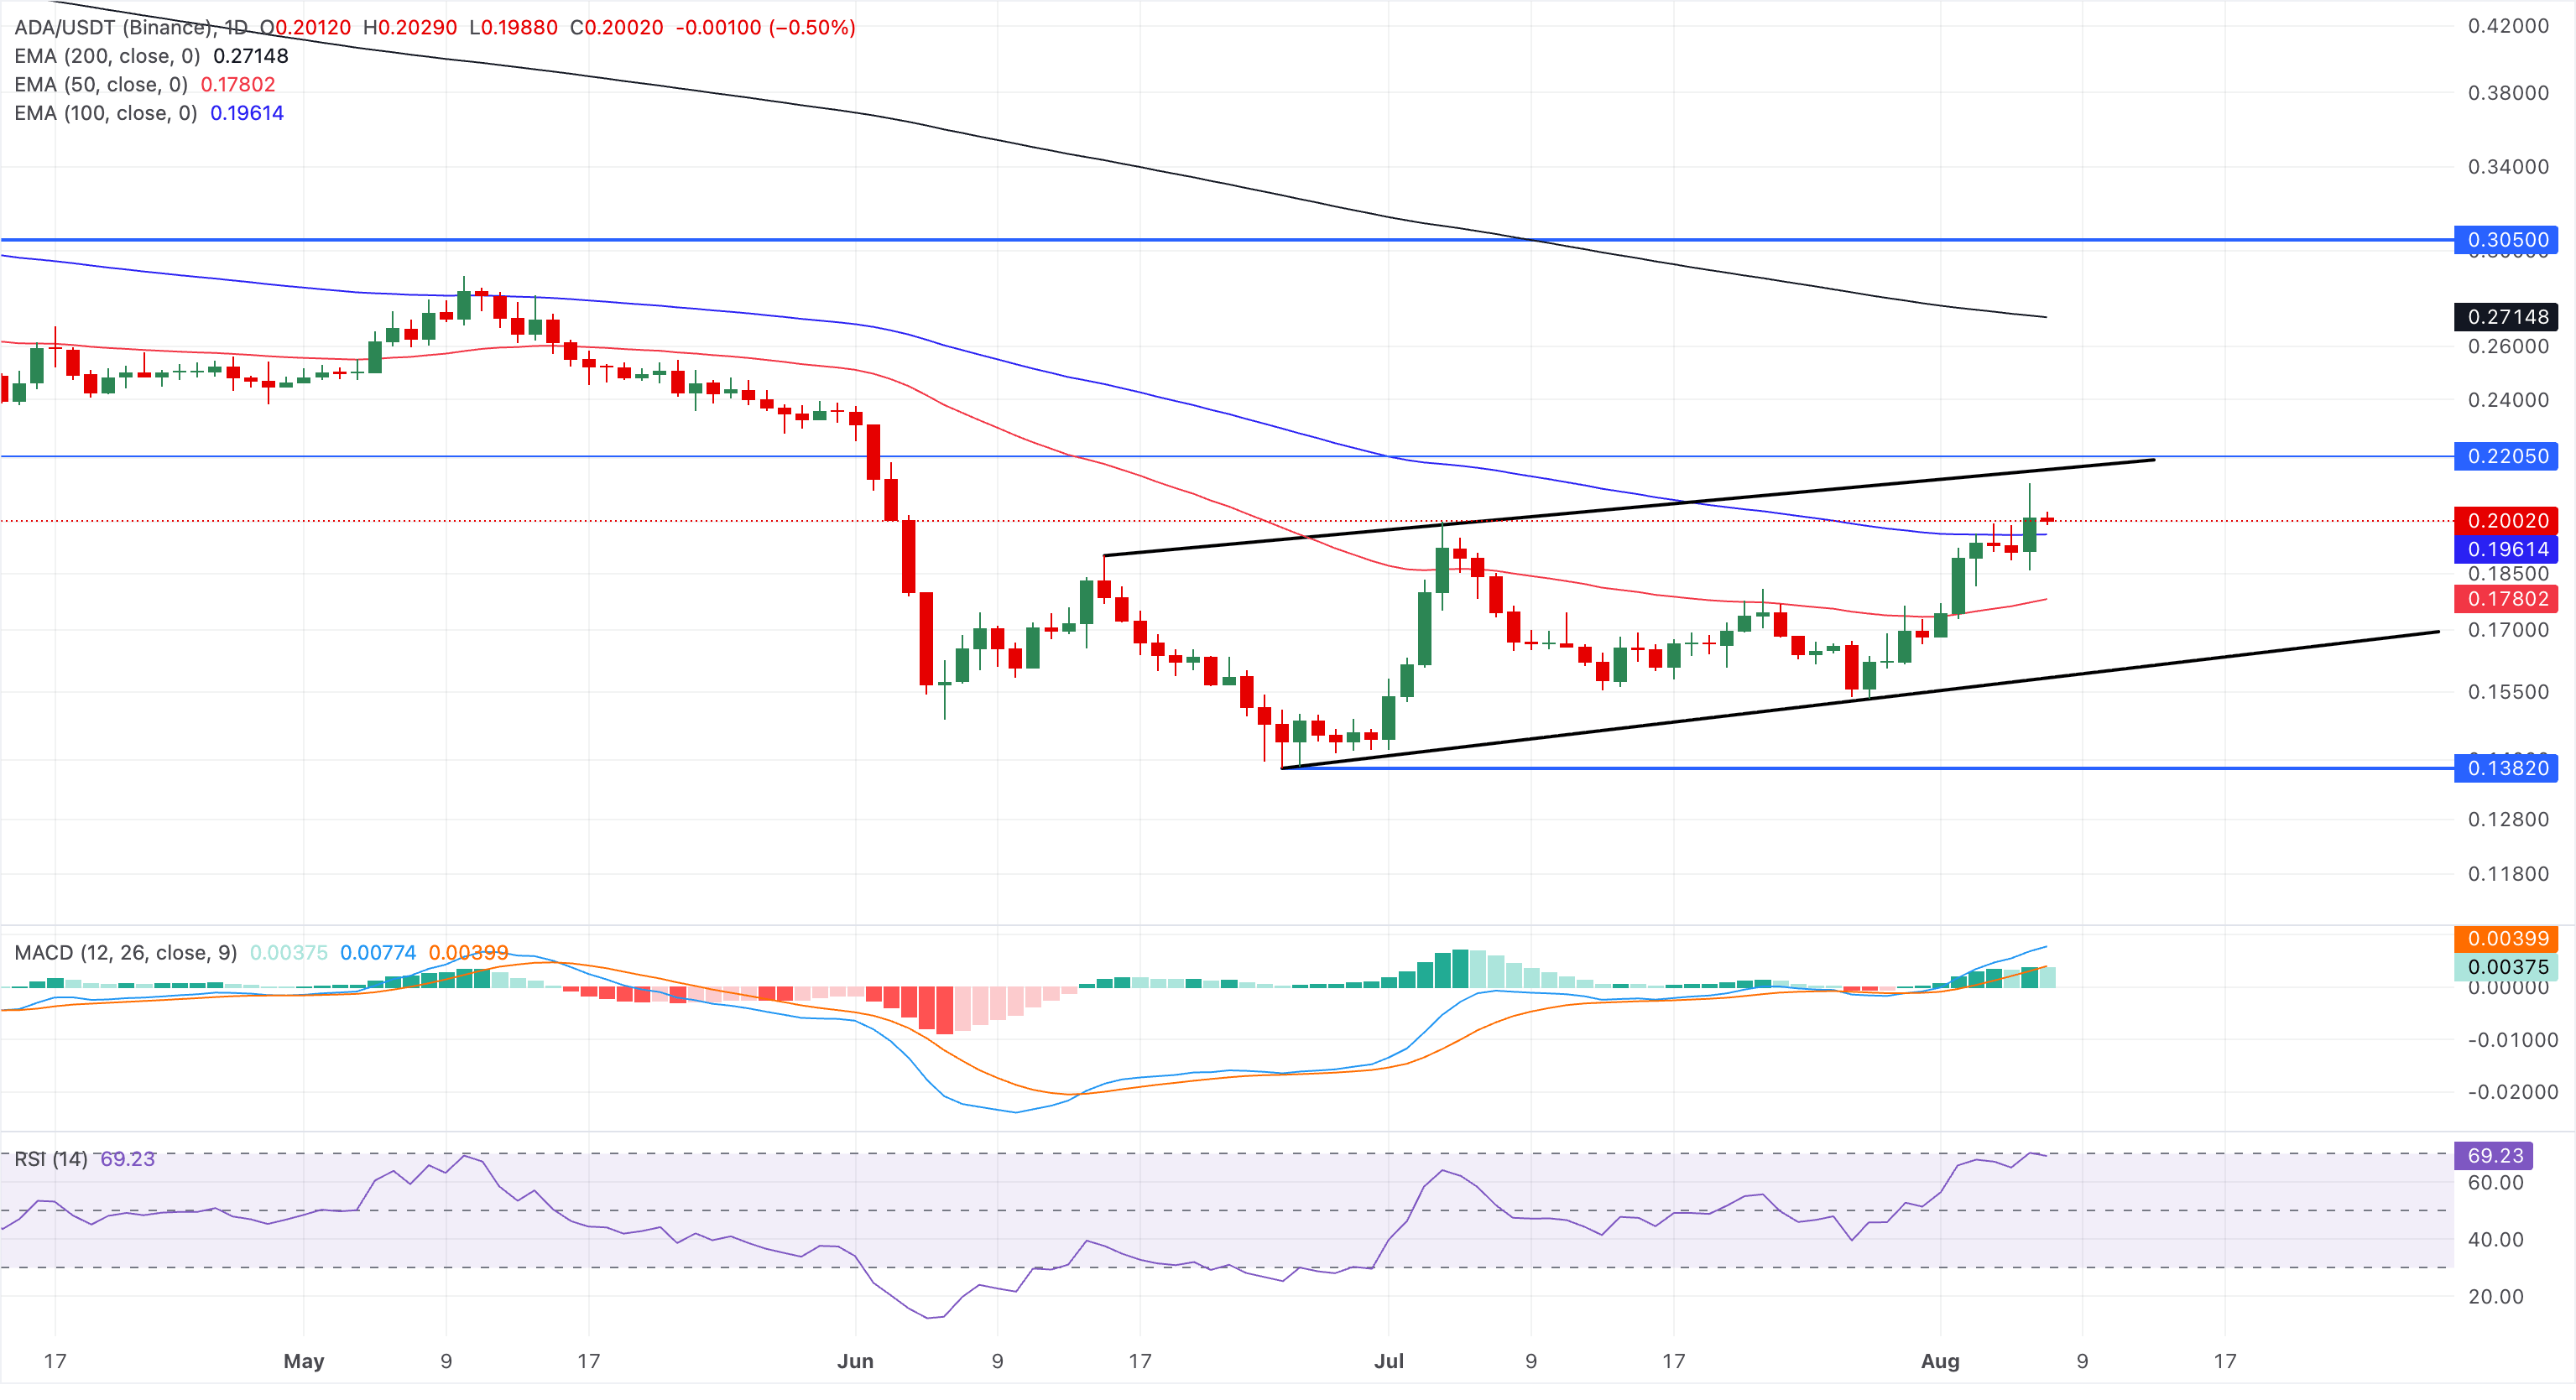
On the downside, immediate support is seen at the 100-day EMA at $0.1970, with the 50-day EMA at $0.1780 and the rising trendline near $0.1590 reinforcing a deeper structural floor if a correction unfolds.
LayerZero trades below the 50-day EMA at $0.8732, the 100-day EMA at $1.0408, and the 200-day EMA at $1.2871, suggesting the broader trend remains under pressure. At the time of writing, ZRO steadies around $0.8200 on Friday, sustaining the 5% gains from the previous day.
From a technical perspective, the ZRO price shows a contracting downside trend, forming a falling wedge pattern on the daily chart. The 50-day EMA at $0.8732 reinforces the overhead trendline, where a decisive breakout could extend the rally toward the 100-day EMA at $1.0480.
The MACD and signal line continue to rise after the recent bullish crossover in negative territory, while the RSI hovers at 51, hinting at modest but not decisive buying interest.
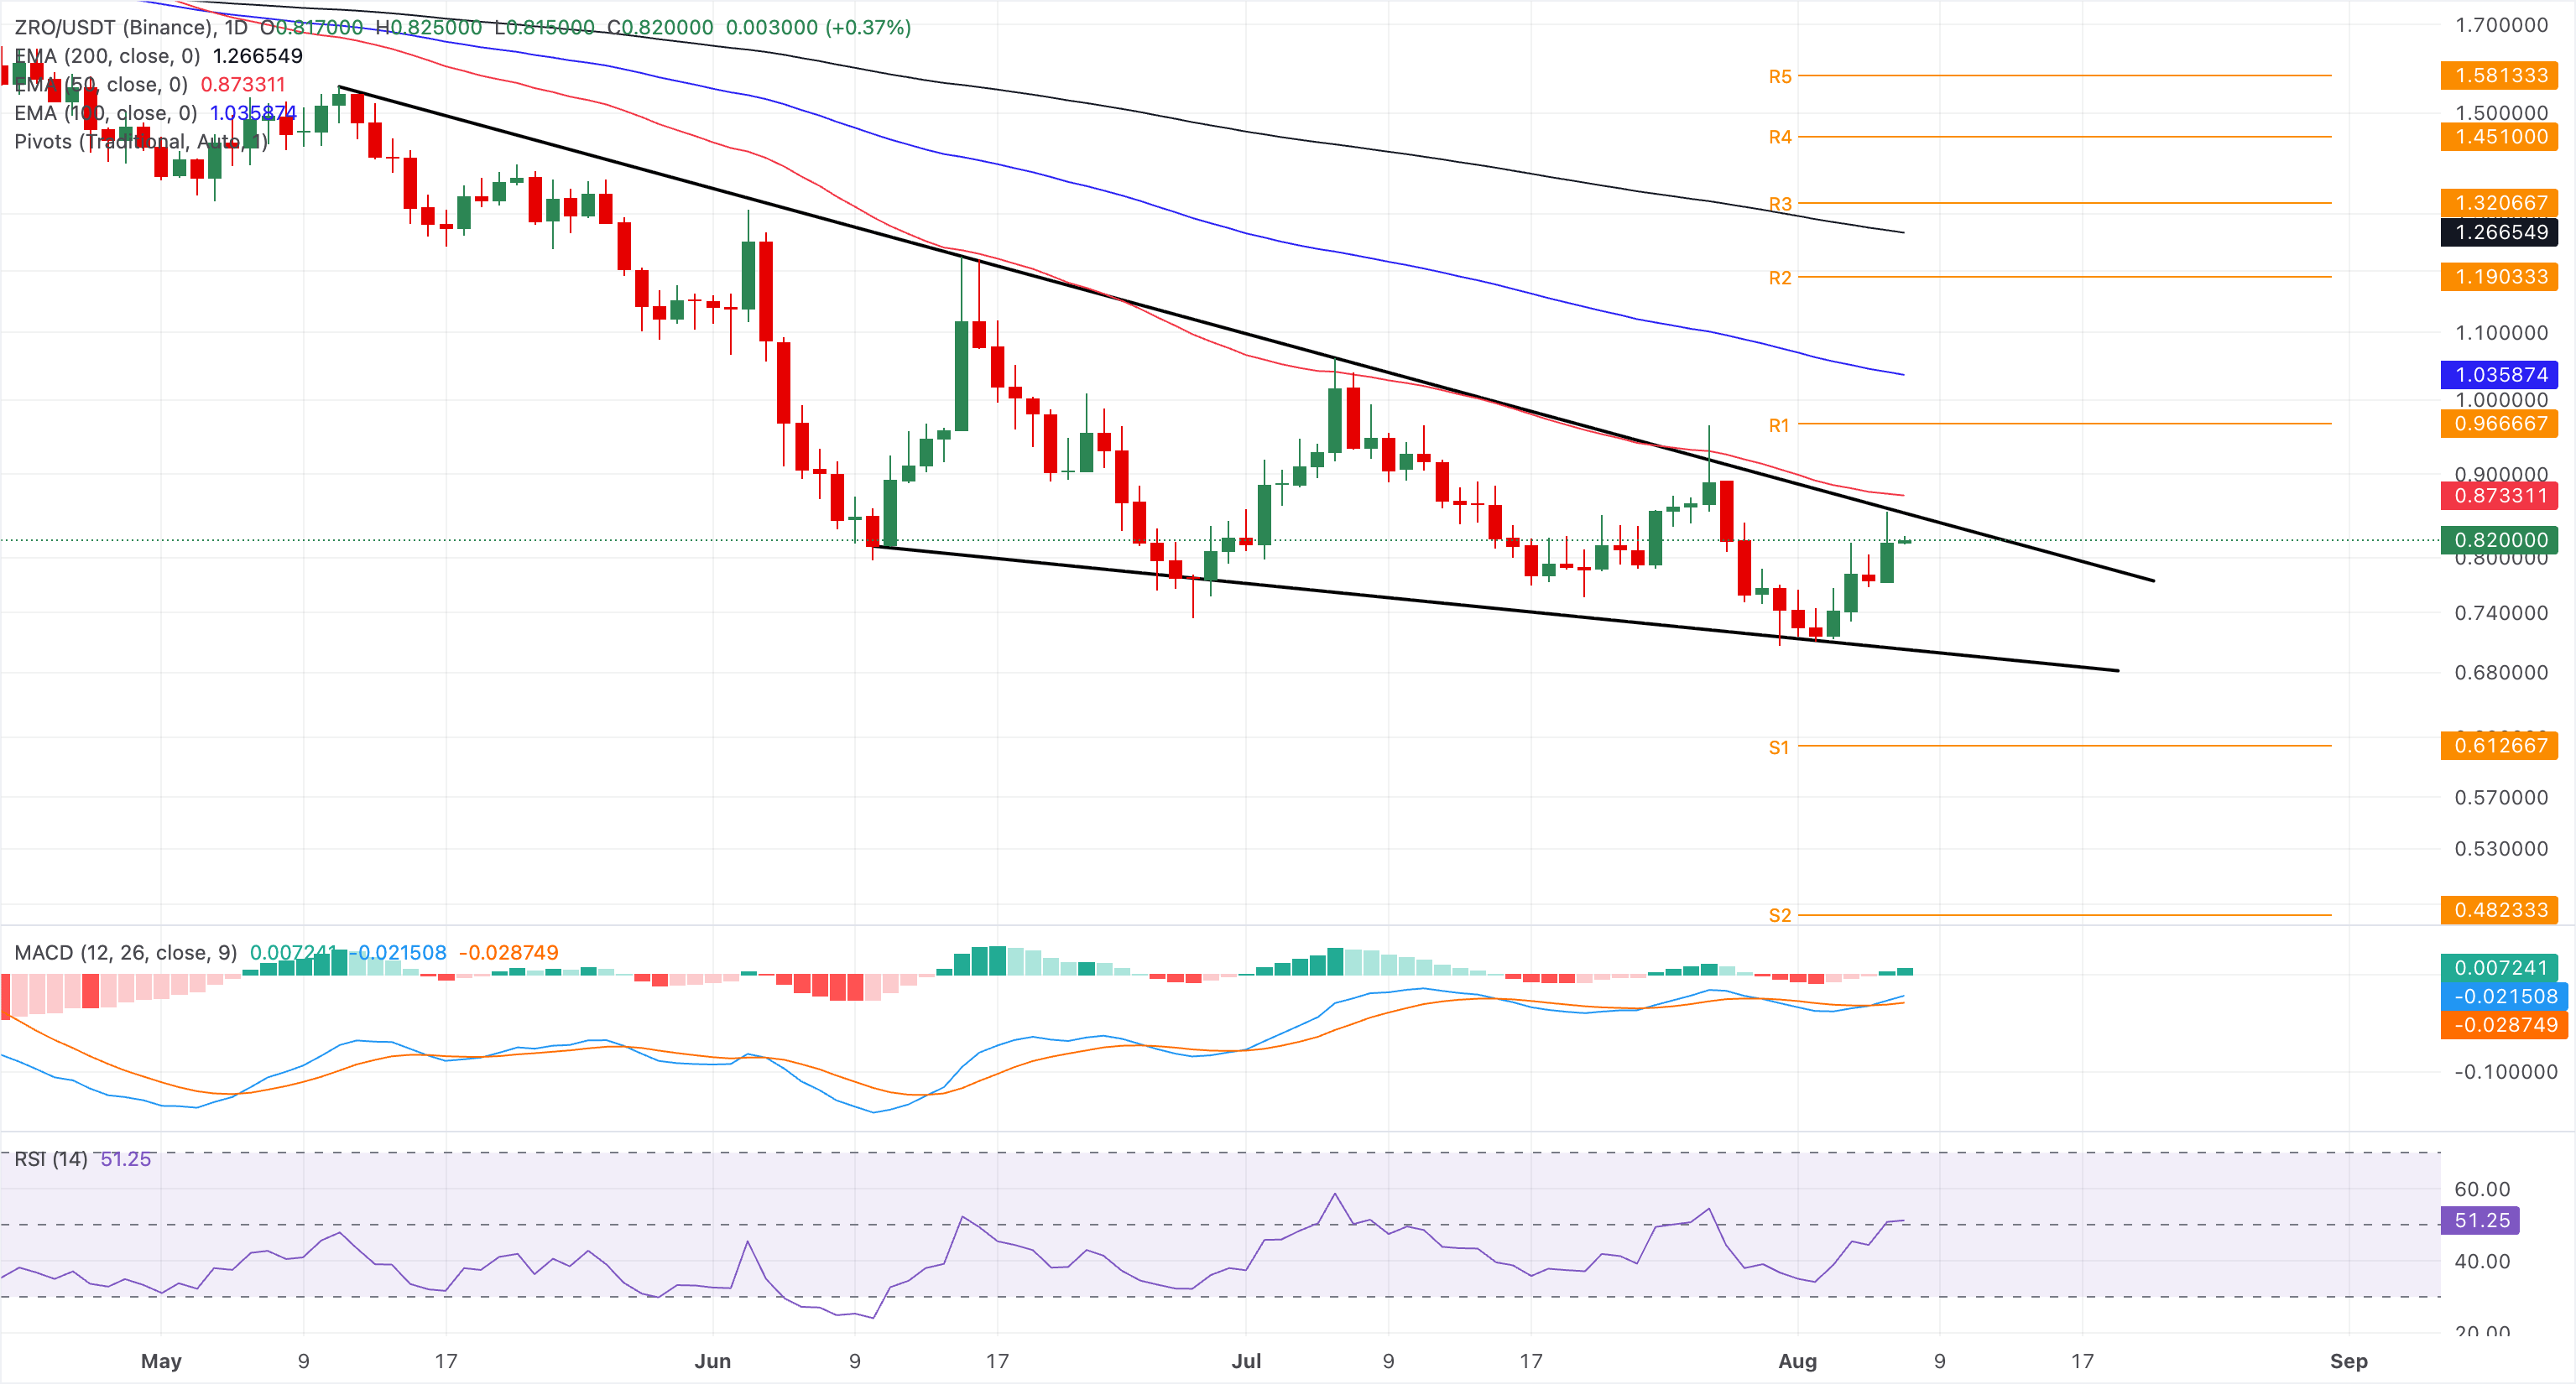
Looking down, the support trendline near $0.7000 serves as the ultimate support, guarding the downside to the S1 Pivot level at $0.6126.
(The technical analysis of this story was written with the help of an AI tool. Know more.)
Recommended Articles


