


Crypto Overview: Bitcoin steadies above $64,000 – PUMP, ZEC sustain gains
- Bitcoin trades above $64,000 on Wednesday, inching closer to the 50-day EMA at $64,652.
- Pump.fun steadies after a 13% rise the previous day, with bulls eyeing up to 40% upside.
- Zcash edges higher following a roughly 5% rise on Tuesday, extending gains above its 50-day EMA at $486.
Bitcoin (BTC) price edges above $64,000 at press time on Wednesday, heading toward its 50-day Exponential Moving Average (EMA) at $64,652. Meanwhile, Pump.fun (PUMP) and Zcash (ZEC) sustain gains after a rebound on Tuesday, with bulls eyeing further upside.
Technical outlook: Will Bitcoin reclaim $65,000?
Bitcoin retains a broader bearish bias, trading below the 50-day EMA at $64,652 and well under the 200-day EMA at $73,069. The King Crypto must reclaim the 50-day EMA at $64,652 to challenge the $67,516 resistance level marked by the June 3 high. A sustained close above this level could confirm the bullish reversal in Bitcoin.
Momentum is mixed on the daily chart, with the Relative Strength Index (RSI) at 51 broadly neutral, while the Moving Average Convergence Divergence (MACD) and signal line prepare for a bullish crossover as the negative histogram contracts, hinting at still-soft underlying demand.
Looking down, the key support for BTC lies near the $60,000 psychological level, followed by the June 25 swing low of $58,115.
Technical outlook: Could PUMP and ZEC extend gains?
PUMP holds steady on Wednesday, following a 13% jump the previous day. The launchpad token trades above the 200-day EMA at $0.002153, while the 50- and 100-day EMAs signal a bullish crossover, indicating a bullish bias in the near term.
The RSI hovers in overbought territory near 71, hinting that upside momentum is strong but also vulnerable to a pause or minor shakeout if buyers hesitate at this trend barrier.
The first obstacle for PUMP aligns with the December 3 high at $0.003399, indicating a roughly 40% upside potential.
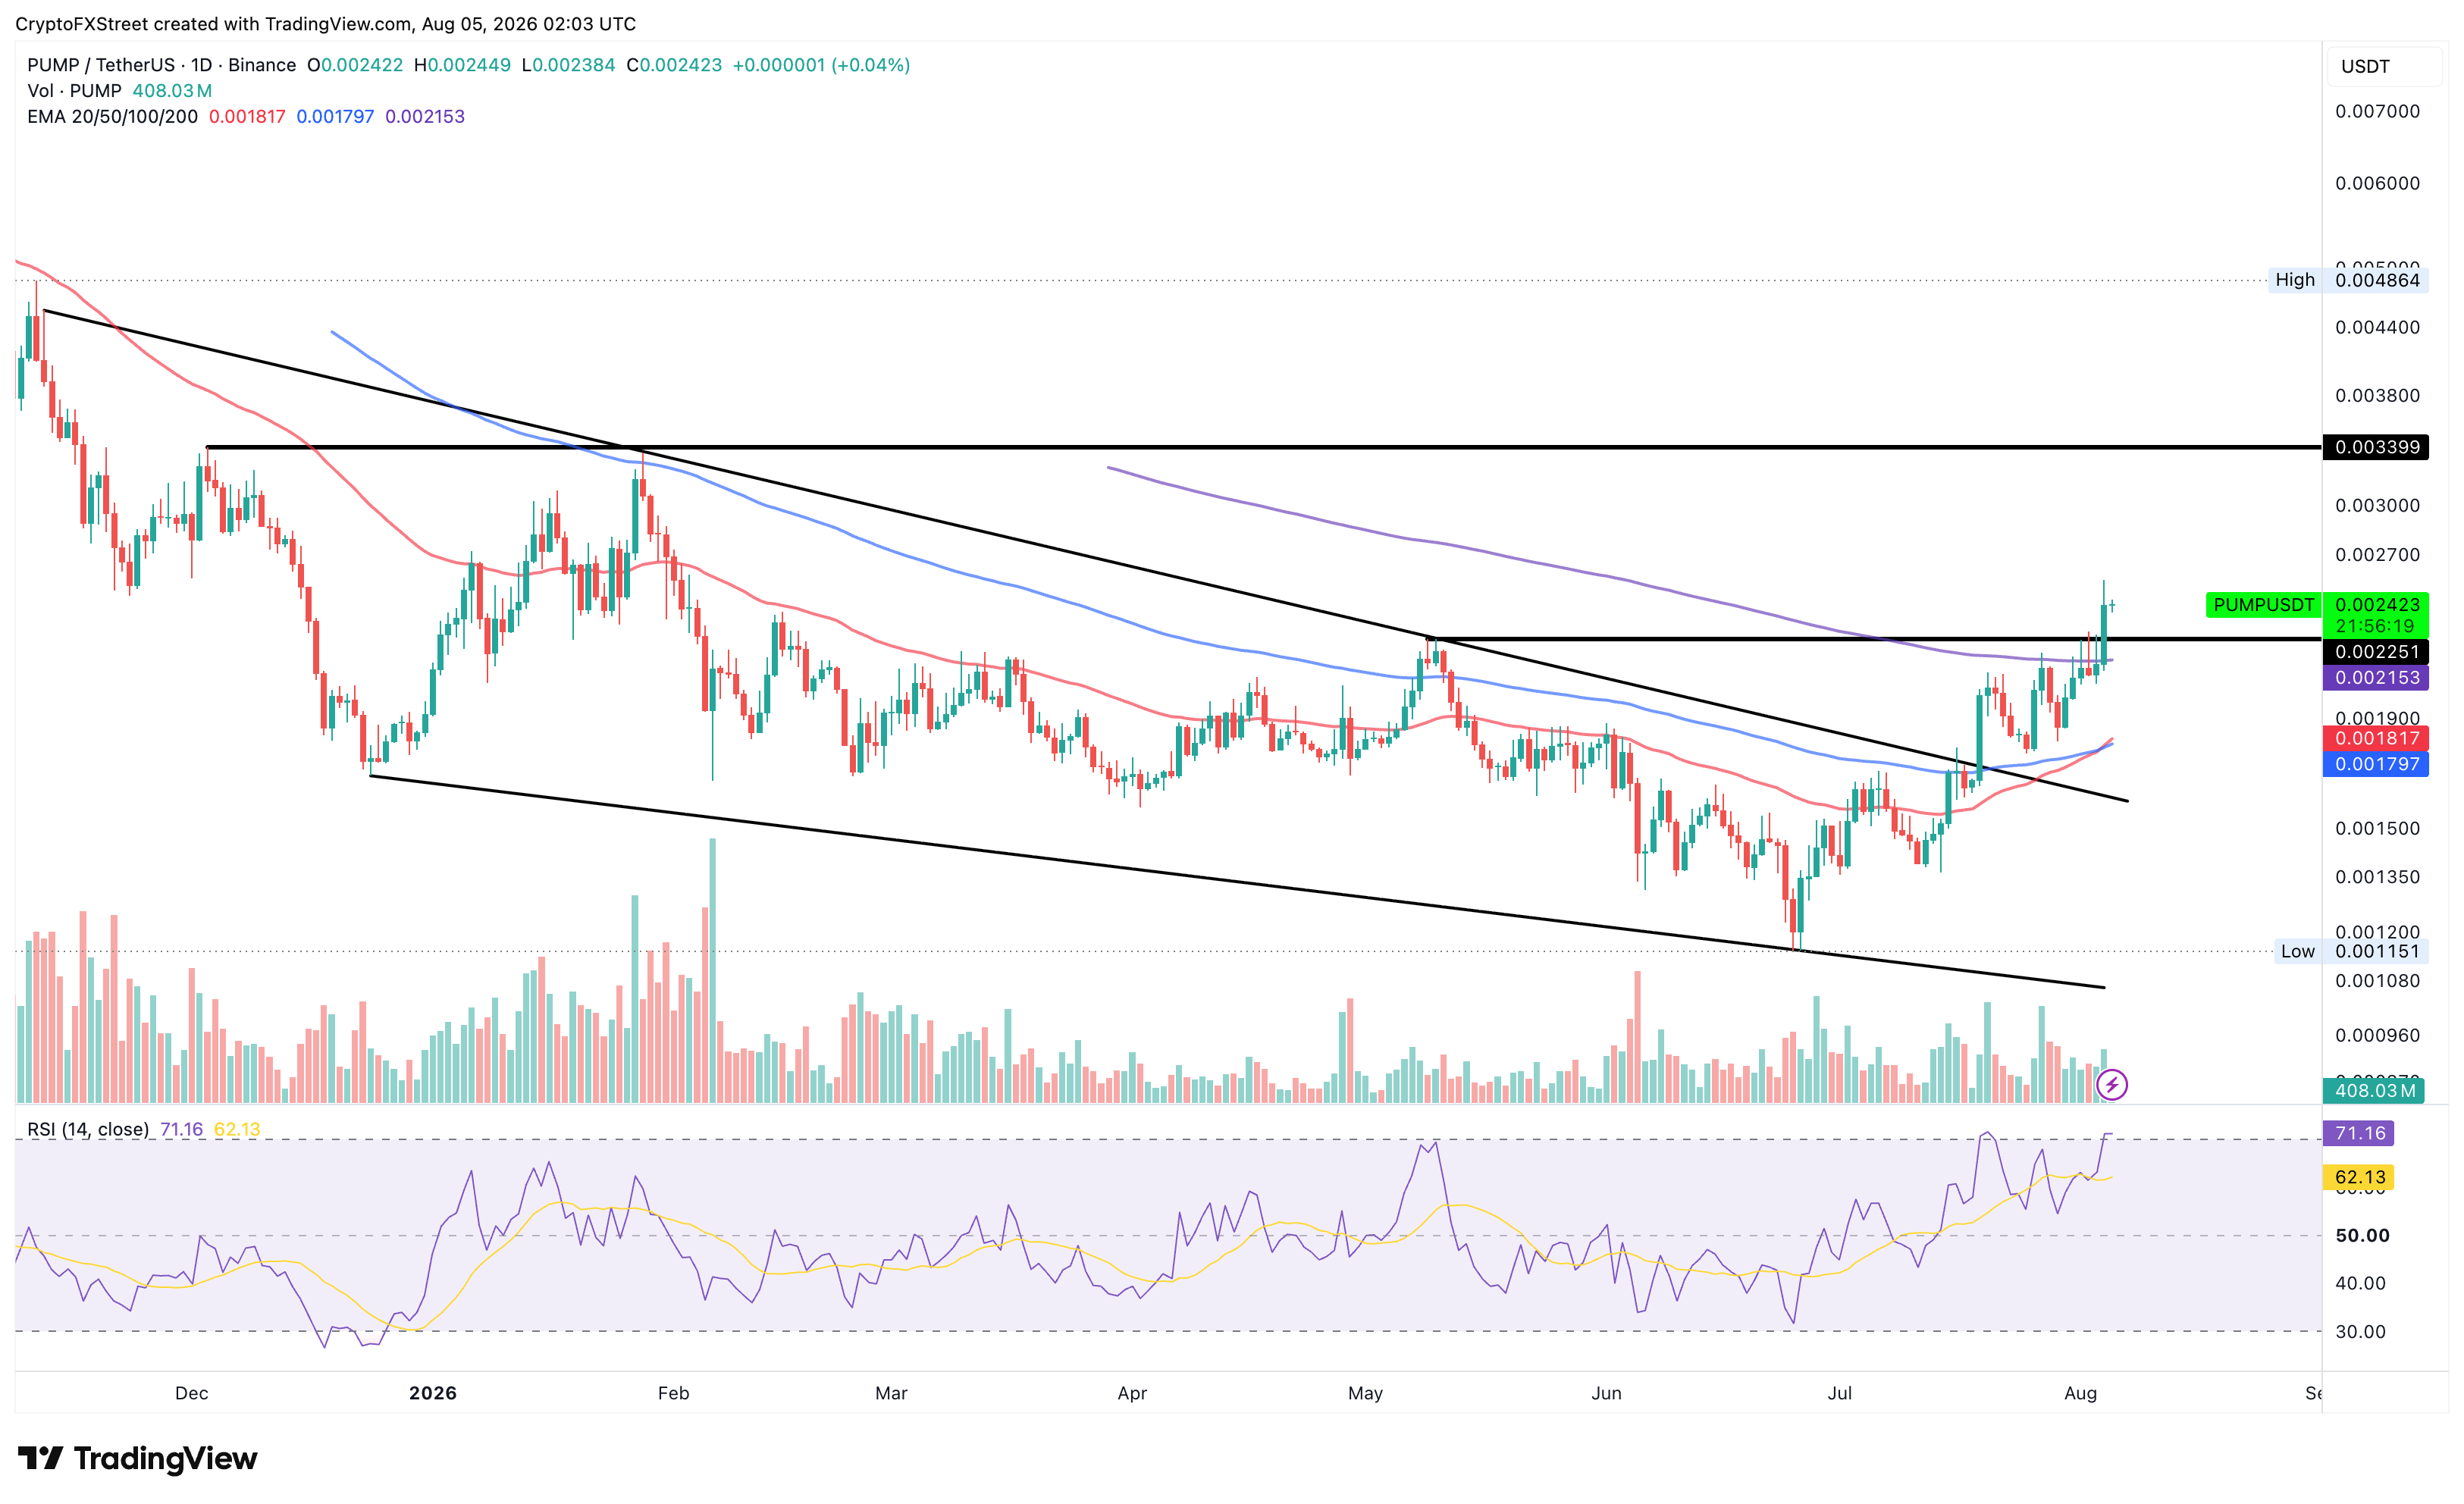
On the downside, initial protection is provided by the 200-day EMA at $0.002153, followed by the 50-day EMA at $0.001817.
Zcash trades above $500 on Wednesday, sustaining the 5% rebound gains from the previous day. The privacy coin maintains a constructive bullish bias, with price remaining above both the 50-day EMA at $486 and the 200-day EMA at $409.
From a technical perspective, the recent rebound from the rising support trendline, with a 6% jump on Sunday, reinforces an upward cycle toward the overhead trendline near $550. A decisive close above this trendline could renew the rally in Zcash, potentially targeting the May 20 record high of $690.
Momentum metrics support the upside tone, with the RSI rising to 55 and the MACD on the verge of crossing above its signal line, hinting at fading bearish pressure.
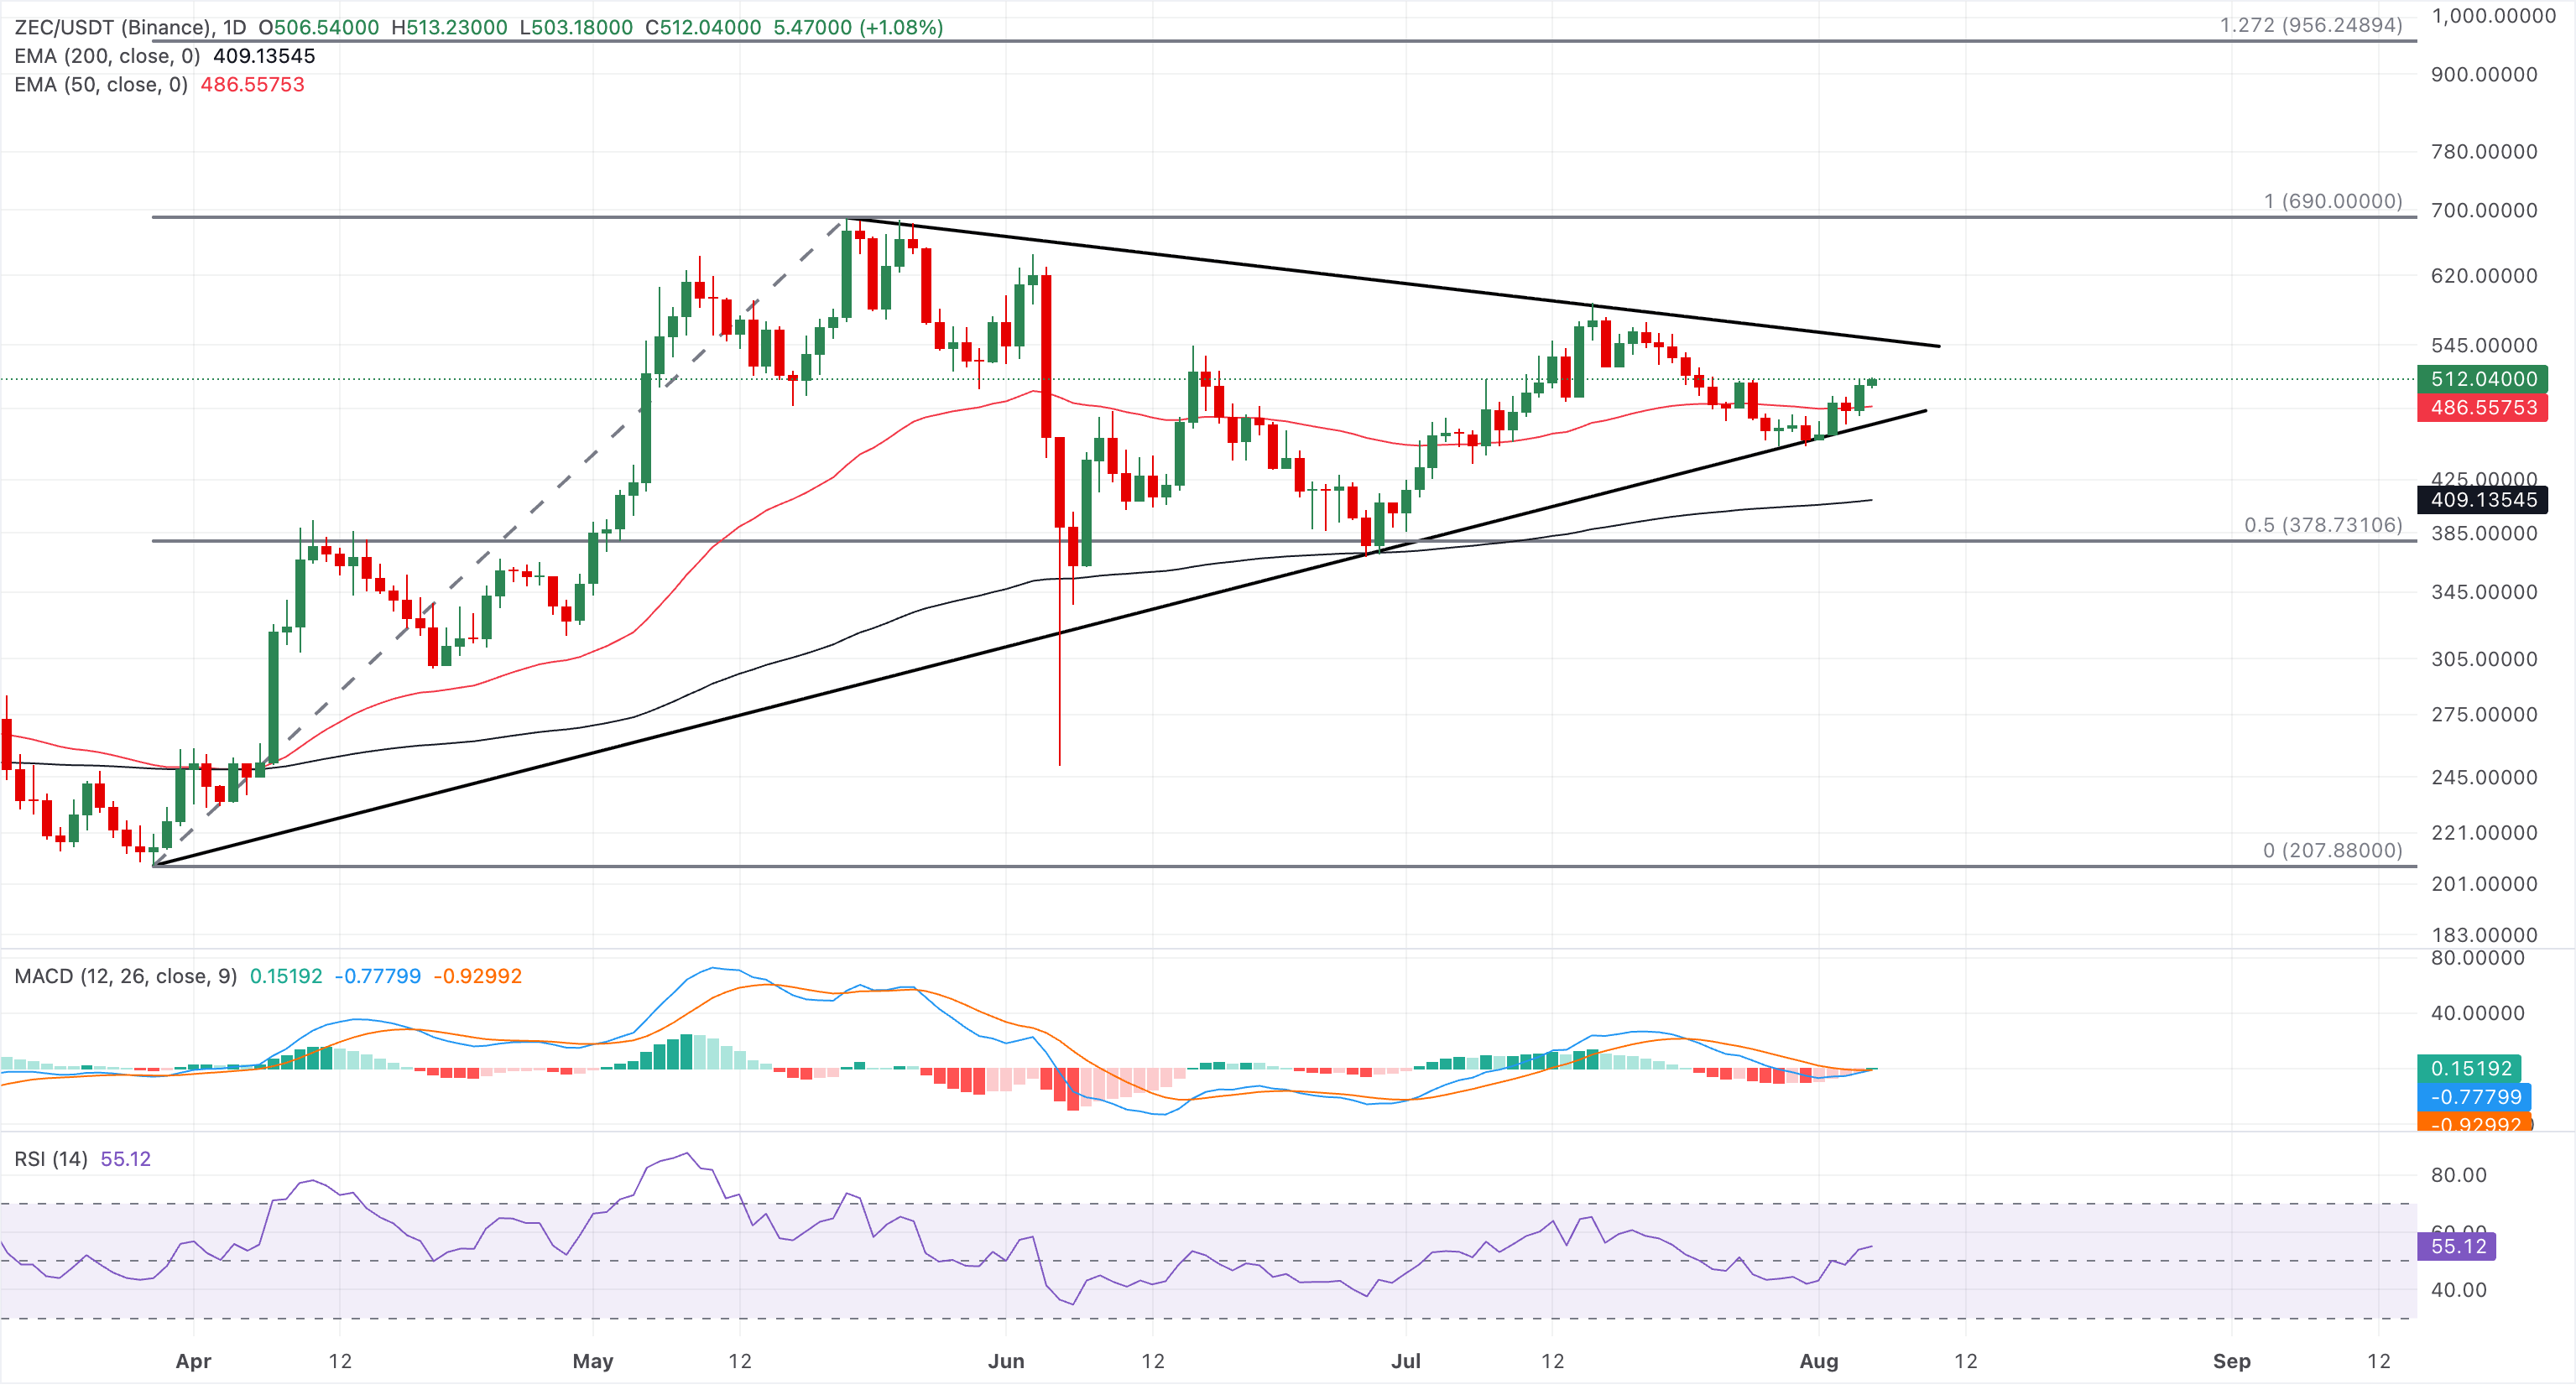
On the downside, initial support is seen at the $500 psychological mark, followed by the 50-day EMA at $486 and then the rising trendline support around $474.
(The technical analysis of this story was written with the help of an AI tool. Know more.)
Recommended Articles


