Solana Price Forecast: SOL risks a steeper decline below $70 despite steady ETF inflows

Source Fxstreet
  • Solana edges lower on Monday, facing downside pressure with the price capped below its 50-day EMA at $75.68.
  • Institutional demand shows resilience with five consecutive weekly inflows totaling $14.62 million in July.
  • Retail demand eases as trading volume declines and the funding rate turns negative. 

Solana (SOL) is trading in the red on Monday, losing bullish momentum and remaining capped below its 50-day Exponential Moving Average (EMA) at $75.68. SOL-focused Exchange Traded Funds (ETFs) show resilience with a monthly inflow of $14.62 million in July, while the near-term retail support wanes with the funding rate turning negative. The technical outlook for SOL is mildly bearish as downside momentum gains traction. 

Solana loses retail strength despite resilient ETF inflows

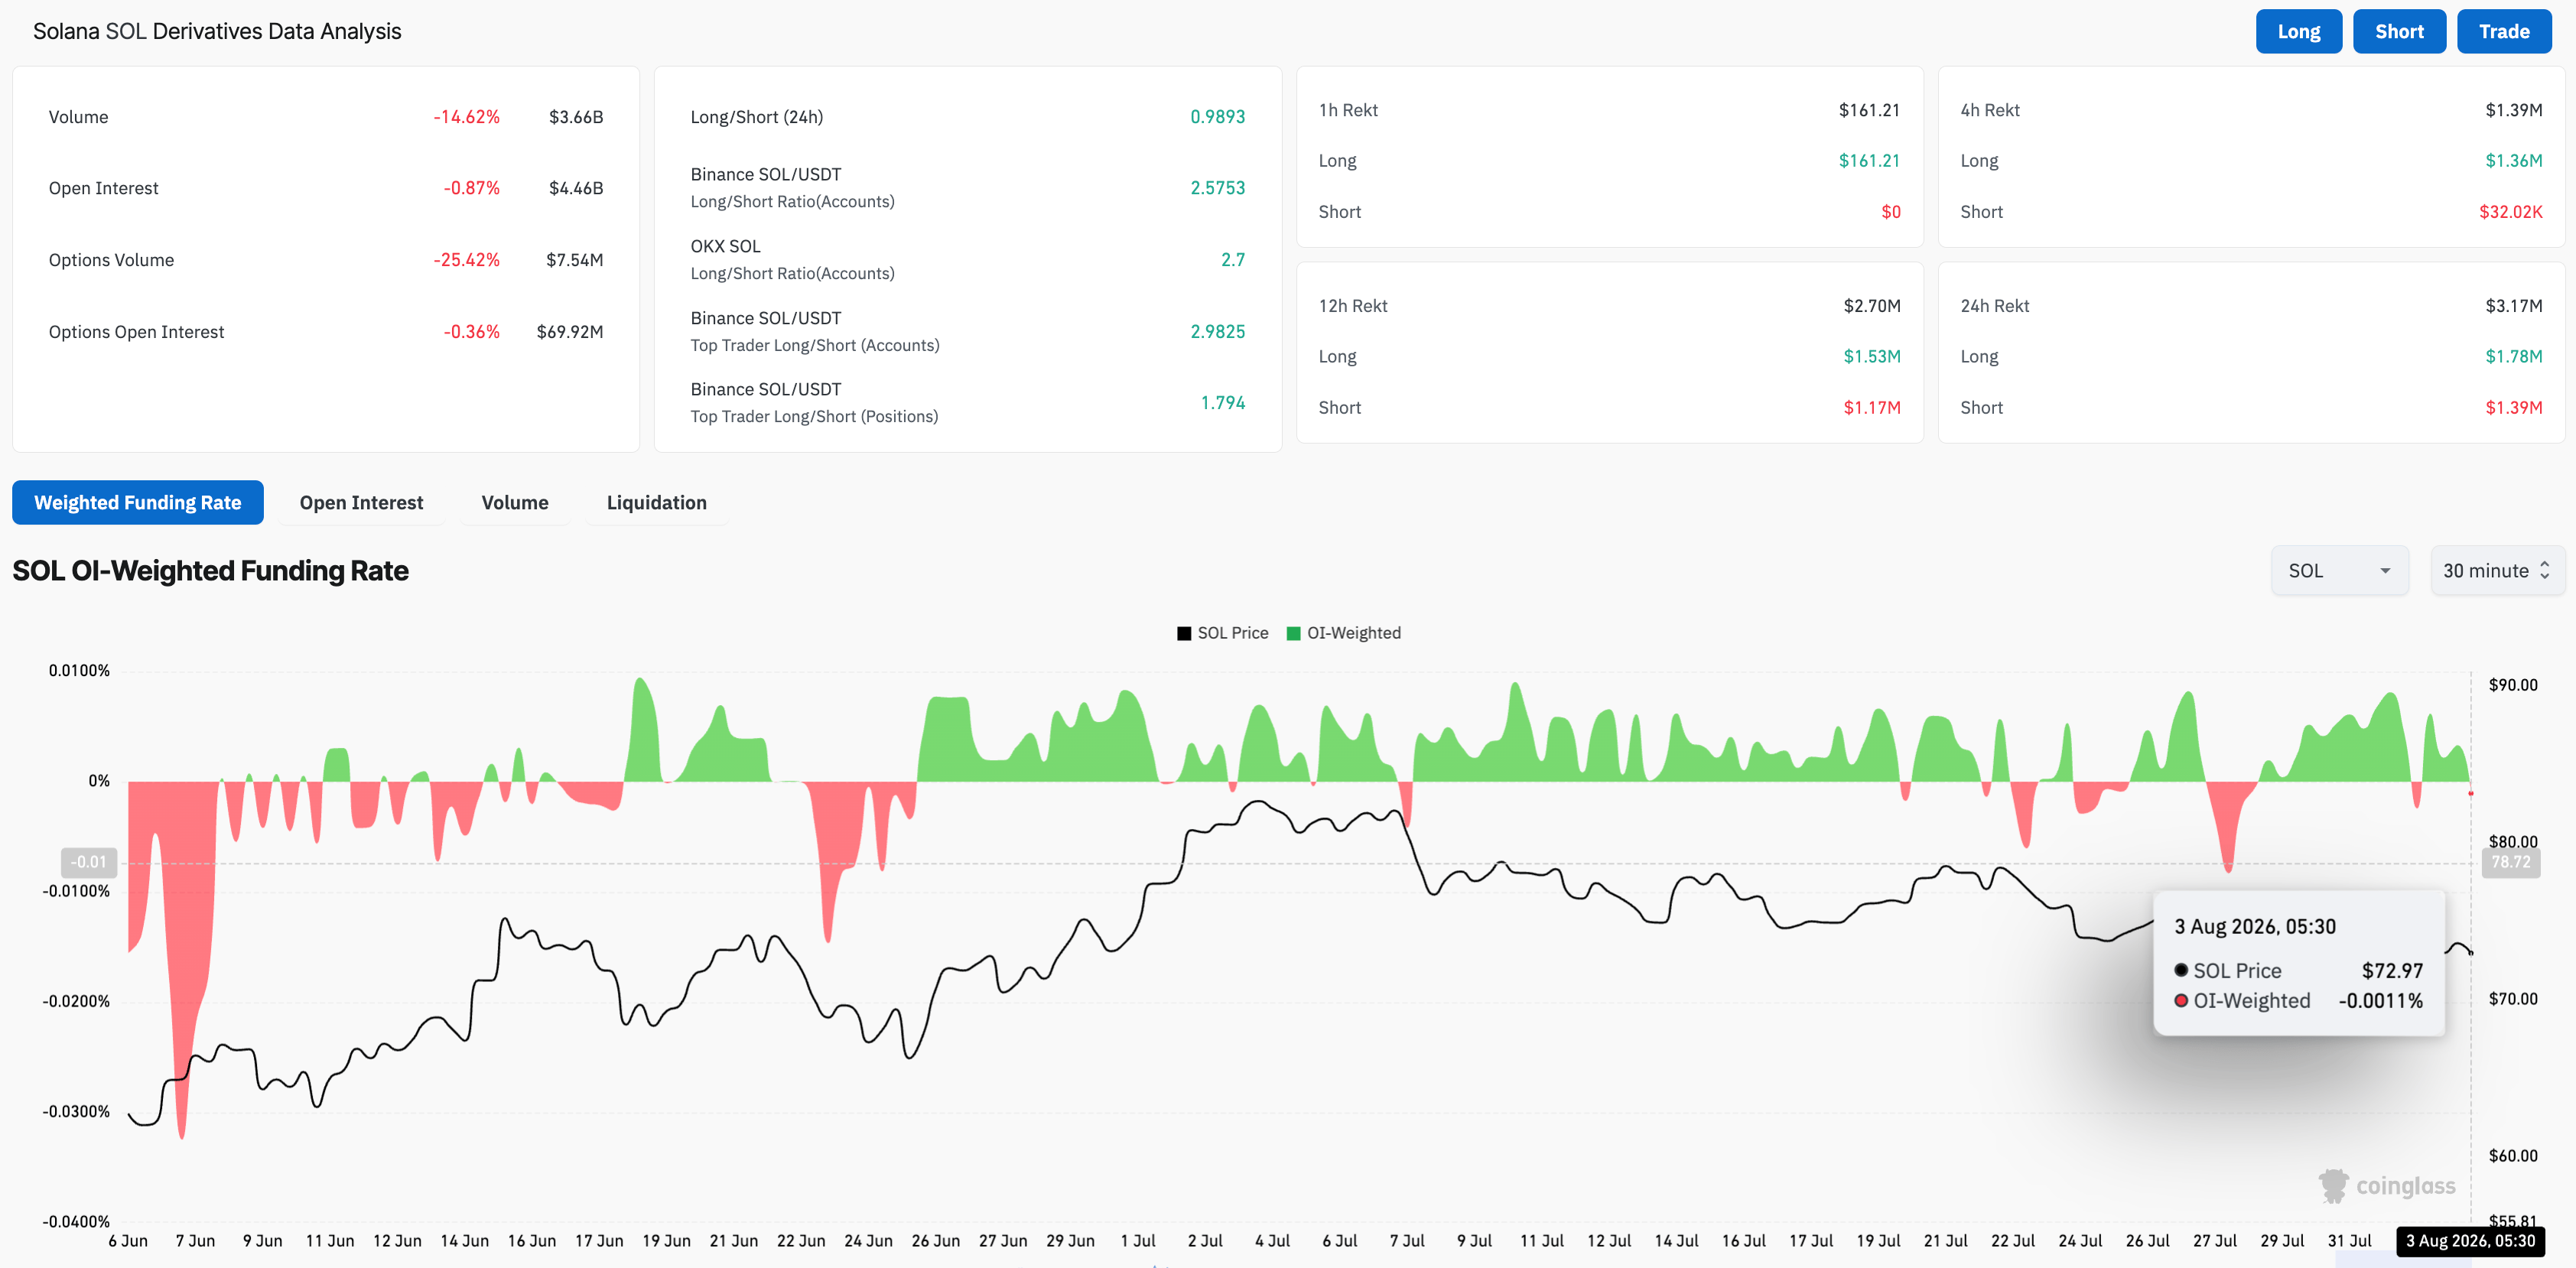
Solana is facing reduced speculative demand as broader crypto market sentiment weakens, while institutional investors remain resilient. CoinGlass data shows that SOL futures trading volume fell 14% over the last 24 hours to $3.66 billion, indicating reduced retail activity. Meanwhile, the funding rate – the premium traders are willing to pay to hold a position – has flipped negative to -0.0011% from a peak of 0.0062% on Sunday, pointing to a bearish bias. 

On the other hand, SOL ETFs recorded $2.82 million in inflows last week, extending a streak of five consecutive weekly inflows and bringing July inflows to $14.62 million. This marks the lowest monthly positive flow, up from $786,580 in outflows in May, which could be an early sign of renewed institutional demand. 
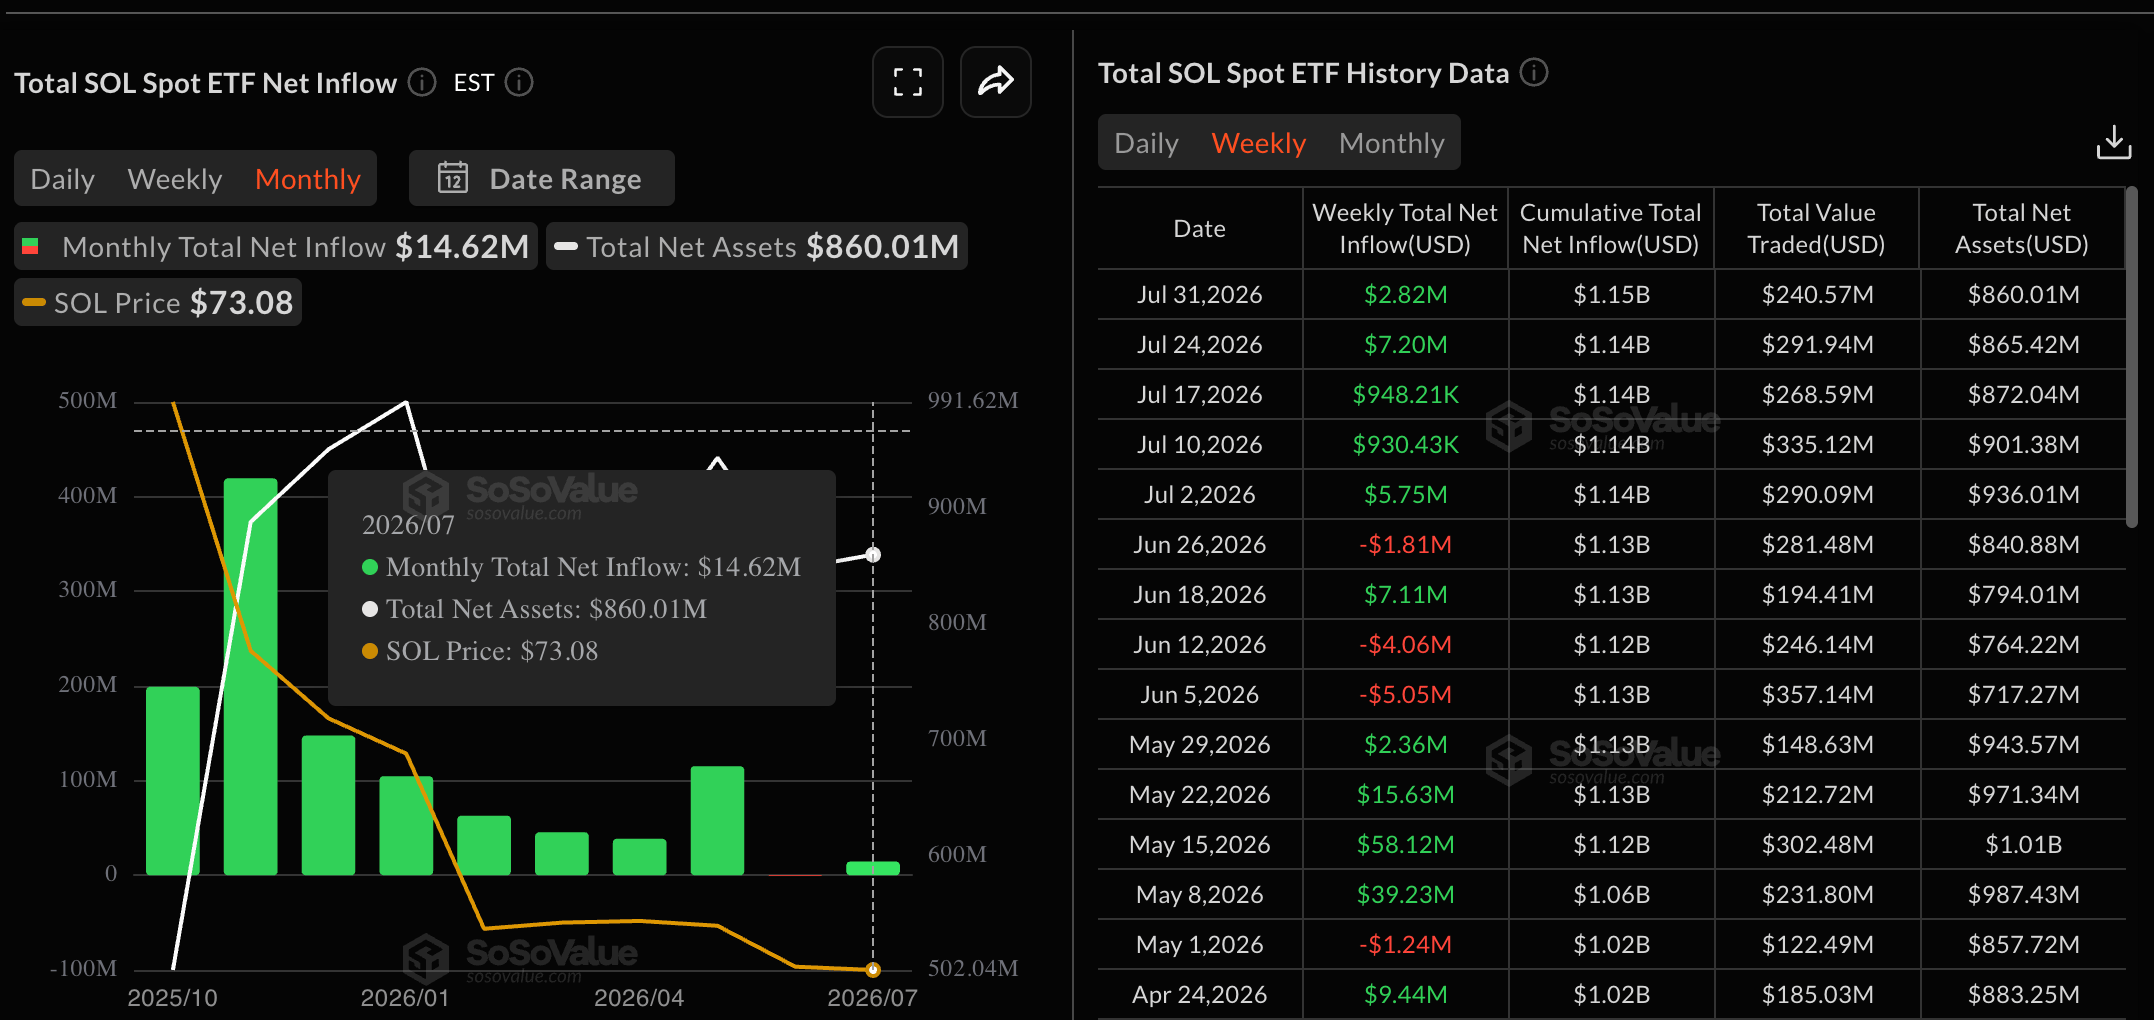
SOL ETFs data. Source: Sosovalue
SOL derivatives data. Source: CoinGlass

Technical outlook: Will Solana price drop below $70?

Solana maintains a bearish near-term tone, capped below its 50-day EMA at $75.68 and well under the 200-day EMA at $92.69. From a technical perspective, SOL trades below a descending trendline near $76.06 and is heading toward the support trendline near $71.30.

A decisive close below this zone could extend the decline toward the 78.6% Fibonacci retracement of the downswing from the $98.41 high to the $60.13 low, at $66.81

Momentum aligns with this capped structure, as the Relative Strength Index (RSI) at 43 hovers below the midline and the Moving Average Convergence Divergence (MACD) remains negative below the signal line, suggesting firm downside pressure.

Chart Analysis SOL/USDT (Binance)
SOL/USDT daily price chart.

On the topside, immediate resistance is clustered between the 50-day EMA at $75.68 and the trendline break level at $76.06. Further up, the 50% retracement at $79.27 defines a key barrier before the 23.6% retracement at $87.60 and the 200-day EMA at $92.69.

(The technical analysis of this story was written with the help of an AI tool. Know more.)

Disclaimer: For information purposes only. Past performance is not indicative of future results.
placeholder
Japan, South Korea Stocks Rise in Early Trade; Samsung, SK Hynix Soar, SoftBank, Kioxia Track GainsTradingKey - Both the KOSPI and Nikkei 225 indexes opened higher, led by gains in Samsung Electronics and SK Hynix, with SoftBank and Kioxia following suit.During the Asian session on June 30, both Ja
Author  TradingKey
6 Month 30 Day Tue
TradingKey - Both the KOSPI and Nikkei 225 indexes opened higher, led by gains in Samsung Electronics and SK Hynix, with SoftBank and Kioxia following suit.During the Asian session on June 30, both Ja
placeholder
XRP Price Prediction for July 2026: Can Buyers Finally Break the Downtrend?XRP (XRP) price trades near $1.05, caught between a year-long downtrend and a sudden burst of buying.July has historically rewarded XRP holders. This year the month arrives with on-chain accumulation
Author  Beincrypto
6 Month 30 Day Tue
XRP (XRP) price trades near $1.05, caught between a year-long downtrend and a sudden burst of buying.July has historically rewarded XRP holders. This year the month arrives with on-chain accumulation
placeholder
What to Expect From Ethereum (ETH) in July 2026Ethereum (ETH) enters July 2026 trading near $1,570, close to multi-month lows, after recording its first run of three consecutive red quarterly candles in its history.On-chain data and price charts n
Author  Beincrypto
7 Month 01 Day Wed
Ethereum (ETH) enters July 2026 trading near $1,570, close to multi-month lows, after recording its first run of three consecutive red quarterly candles in its history.On-chain data and price charts n
placeholder
Intel Price Forecast: Nvidia Picked Xeon 6, Invested $5B, Yet Analysts Still Trail INTCIntel Corporation (NASDAQ: INTC) sits at $140.05, holding firm on the ascending trendline within the 2H timeframe. The RSI indicator is currently reading 55.21, positioning it as neutral-
Author  TradingKey
7 Month 02 Day Thu
Intel Corporation (NASDAQ: INTC) sits at $140.05, holding firm on the ascending trendline within the 2H timeframe. The RSI indicator is currently reading 55.21, positioning it as neutral-
placeholder
Meta Compute Launch Sends AI Compute Stocks Tumbling GloballyMeta’s plan to sell surplus computing power hit chip stocks hard on Wall Street. Meta’s own shares climbed nearly 9% on the news.The announcement flipped years of assumed AI compute scarcity into a su
Author  Beincrypto
7 Month 02 Day Thu
Meta’s plan to sell surplus computing power hit chip stocks hard on Wall Street. Meta’s own shares climbed nearly 9% on the news.The announcement flipped years of assumed AI compute scarcity into a su
Related Instrument
goTop
quote