


Bitcoin Price Forecast: BTC recovery pauses as hawkish Fed, US-Iran tensions weigh on sentiment
- Bitcoin consolidates at around $64,000 on Thursday after a mild recovery, holding above a key technical support.
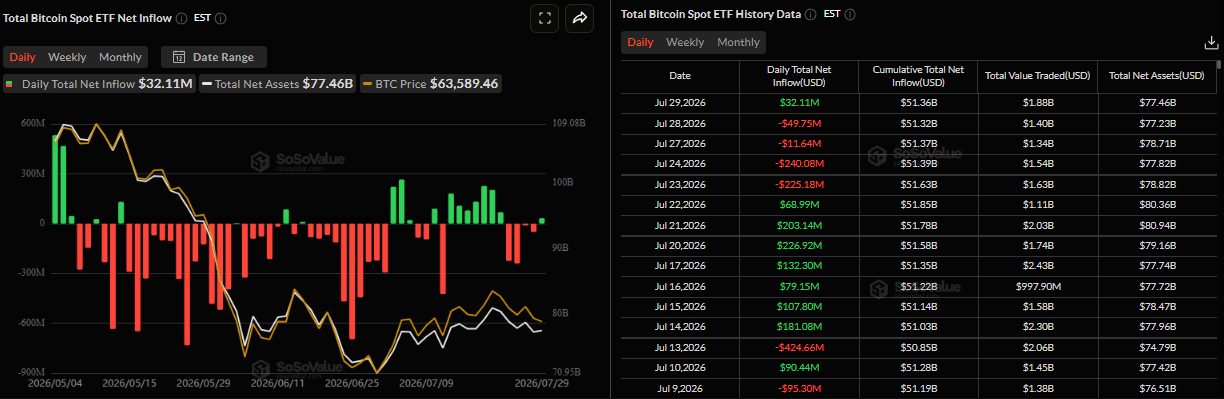
- US-listed BTC spot ETFs recorded a mild inflow of $32.11 million on Wednesday, snapping the four consecutive days of outflows.
- Fed Chair Kevin Warsh's hawkish stance and escalating US-Iran tensions renewed inflation concerns, capping BTC upside.
Bitcoin (BTC) steadies above a key support zone on Thursday, consolidating near $64,000 after a modest rebound earlier this week. Fresh inflows into BTC spot Exchange Traded Funds (ETFs) has provided some support. However, traders should be cautious as renewed inflation concerns, fueled by the Federal Reserve (Fed) hawkish tone and the escalating US-Iran conflict, continue to cap the Crypto King's upside momentum.
Hawkish tone and Middle East tensions cap BTC upside
The Federal Reserve left its benchmark interest rate unchanged at 3.50%-3.75% on Wednesday, marking its fifth consecutive pause, in line with market expectations. However, three Fed officials dissented in favor of a quarter-point rate hike, highlighting growing internal concern over inflation risks.
Fed Chair Kevin Warsh struck a hawkish tone during his post-meeting press conference, helping the US Dollar (USD) recover and tempering appetite for risk assets. Markets continue to price in the possibility of further policy tightening as inflation risks are amplified by rising geopolitical tensions in the Middle East. The ongoing US-Iran conflict has fueled volatility in crude Oil prices, with concerns centered on potential disruptions surrounding crucial shipping chokepoints – the Strait of Hormuz and the Bab el-Mandeb.
In fact, the US launched strikes against Iran in response to surprise Iranian missile attacks on American forces based in the Middle East on Tuesday. Adding to this, joint US-Saudi strikes against Iran-aligned terrorists in Iraq raise the risk of a broader regional conflict. Moreover, reports suggest that Yemen's Iran-backed Houthis are considering imposing fees on commercial ships sailing through the southern Red Sea.
These renewed attacks keep the geopolitical risk premium in play, adding concerns about significant disruptions to global energy supplies. Such developments have triggered a sharp recovery in crude Oil prices, reviving inflation fears and dampening risk appetite, capping BTC upside potential.
Institutional demand shows mild inflows
Institutional demand shows mild signs of improvement. SoSoValue data shows that US-listed spot BTC ETFs recorded a mild inflow of $32.11 million on Wednesday, breaking the four consecutive days of outflows. If these inflows continue and intensify through the week, BTC could see a recovery in its prices.
Bitcoin technical outlook: Holds above key $64,000 support zone
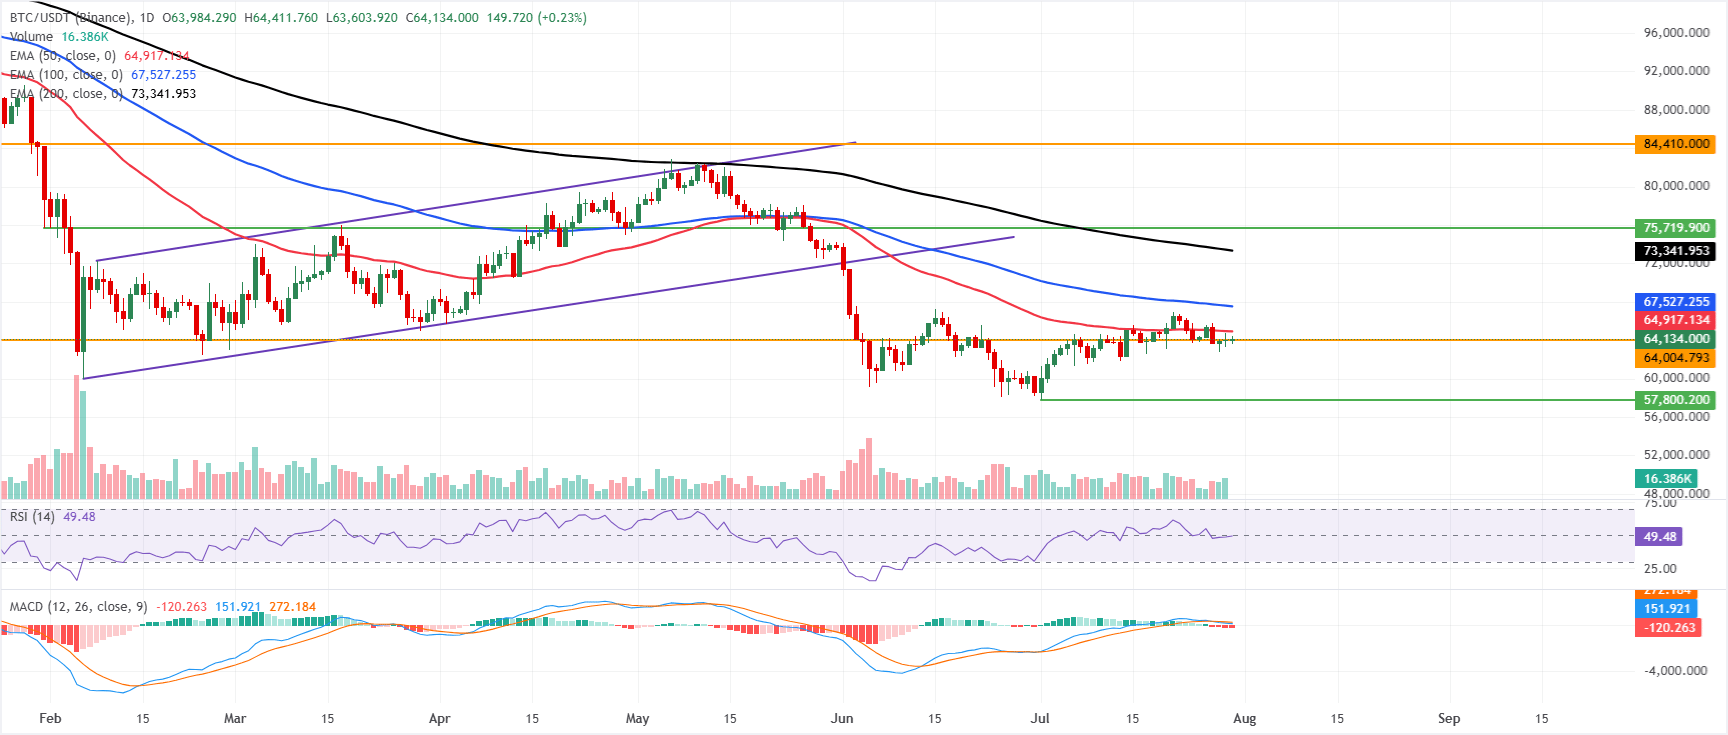
Bitcoin price trades at $64,134 on Thursday, holding below the 50-day Exponential Moving Average (EMA) at $64,917 as well as the 100-day EMA at $67,527 and the 200-day EMA at $73,341, which collectively keep the broader tone bearish.
Momentum is mixed on the daily chart, with the Relative Strength Index (RSI) hovering near a neutral 50. At the same time, the Moving Average Convergence Divergence (MACD) histogram remains in negative territory, hinting that downside pressure still outweighs recovery attempts despite the recent stabilization above nearby horizontal support.
On the downside, immediate support is seen at the horizontal level around $64,004, where a sustained break would likely open the way for a deeper pullback.
On the topside, initial resistance is offered by the 50-day EMA at $64,917, followed by the 100-day EMA at $67,527 and the 200-day EMA at $73,341, before a more distant barrier emerges at the prior horizontal cap near $84,410; as long as price trades beneath this moving average cluster, rallies are likely to remain capped.
(The technical analysis of this story was written with the help of an AI tool. Know more.)
Bitcoin, altcoins, stablecoins FAQs
Bitcoin is the largest cryptocurrency by market capitalization, a virtual currency designed to serve as money. This form of payment cannot be controlled by any one person, group, or entity, which eliminates the need for third-party participation during financial transactions.
Altcoins are any cryptocurrency apart from Bitcoin, but some also regard Ethereum as a non-altcoin because it is from these two cryptocurrencies that forking happens. If this is true, then Litecoin is the first altcoin, forked from the Bitcoin protocol and, therefore, an “improved” version of it.
Stablecoins are cryptocurrencies designed to have a stable price, with their value backed by a reserve of the asset it represents. To achieve this, the value of any one stablecoin is pegged to a commodity or financial instrument, such as the US Dollar (USD), with its supply regulated by an algorithm or demand. The main goal of stablecoins is to provide an on/off-ramp for investors willing to trade and invest in cryptocurrencies. Stablecoins also allow investors to store value since cryptocurrencies, in general, are subject to volatility.
Bitcoin dominance is the ratio of Bitcoin's market capitalization to the total market capitalization of all cryptocurrencies combined. It provides a clear picture of Bitcoin’s interest among investors. A high BTC dominance typically happens before and during a bull run, in which investors resort to investing in relatively stable and high market capitalization cryptocurrency like Bitcoin. A drop in BTC dominance usually means that investors are moving their capital and/or profits to altcoins in a quest for higher returns, which usually triggers an explosion of altcoin rallies.
Recommended Articles


