


Gold caught between softer US Dollar and rising Treasury yields, US PCE awaited
- Gold consolidates below $4,100 after the Fed left interest rates unchanged at its July meeting.
- A weaker US Dollar lends support to Gold, though rising Treasury yields continue to cap gains.
- XAU/USD remains range-bound between $4,000 and $4,200, with momentum indicators indicating a neutral bias.
Gold (XAU/USD) remains trapped in its month-old $4,000-$4,200 range as the Federal Reserve’s (Fed) new era of limited forward guidance fails to shake the precious metal out of its sideways grind after policymakers left interest rates unchanged at 3.50%-3.75%.
At the time of writing, XAU/USD trades around $4,080 during European trading hours on Thursday, recovering from an intraday low of $4,022.
Gold briefly pushed above $4,100 after the Fed kept rates steady, prompting traders to unwind positions built around the possibility of a surprise hike and triggering a sharp pullback in the US Dollar and front-end US Treasury yields.
However, Gold struggled to hold its gains as longer-dated Treasury yields advanced. The 30-year yield climbed above 5.20% for the first time since 2007 as markets zeroed in on Chair Kevin Warsh’s firm stance on inflation and three dissenting votes in favour of a 25-basis-point (bps) rate hike.
While the Fed’s limited forward guidance has left traders guessing about the next policy move, the CME FedWatch Tool still shows a 63% probability of a rate hike in September as the war in the Middle East keeps energy-driven inflation risks elevated.
Those hawkish expectations keep a lid on Gold’s recovery despite a softer US Dollar. The US Dollar Index (DXY), which tracks the Greenback’s value against a basket of six major currencies, trades around 100.67, near its lowest level in two weeks.
Attention now turns to the US Personal Consumption Expenditures (PCE) Price Index, due at 12:30 GMT. The Fed’s preferred inflation gauge could influence Fed rate expectations and provide the next catalyst for Gold prices.
Meanwhile, on the geopolitical front, the US military said it completed a “heavy wave of strikes” against Iran on Thursday in retaliation for Tehran’s ballistic-missile attack on US forces in Jordan, restarting the back-and-forth attacks in the region.
Technical analysis: RSI stays near neutral as XAU/USD searches for direction
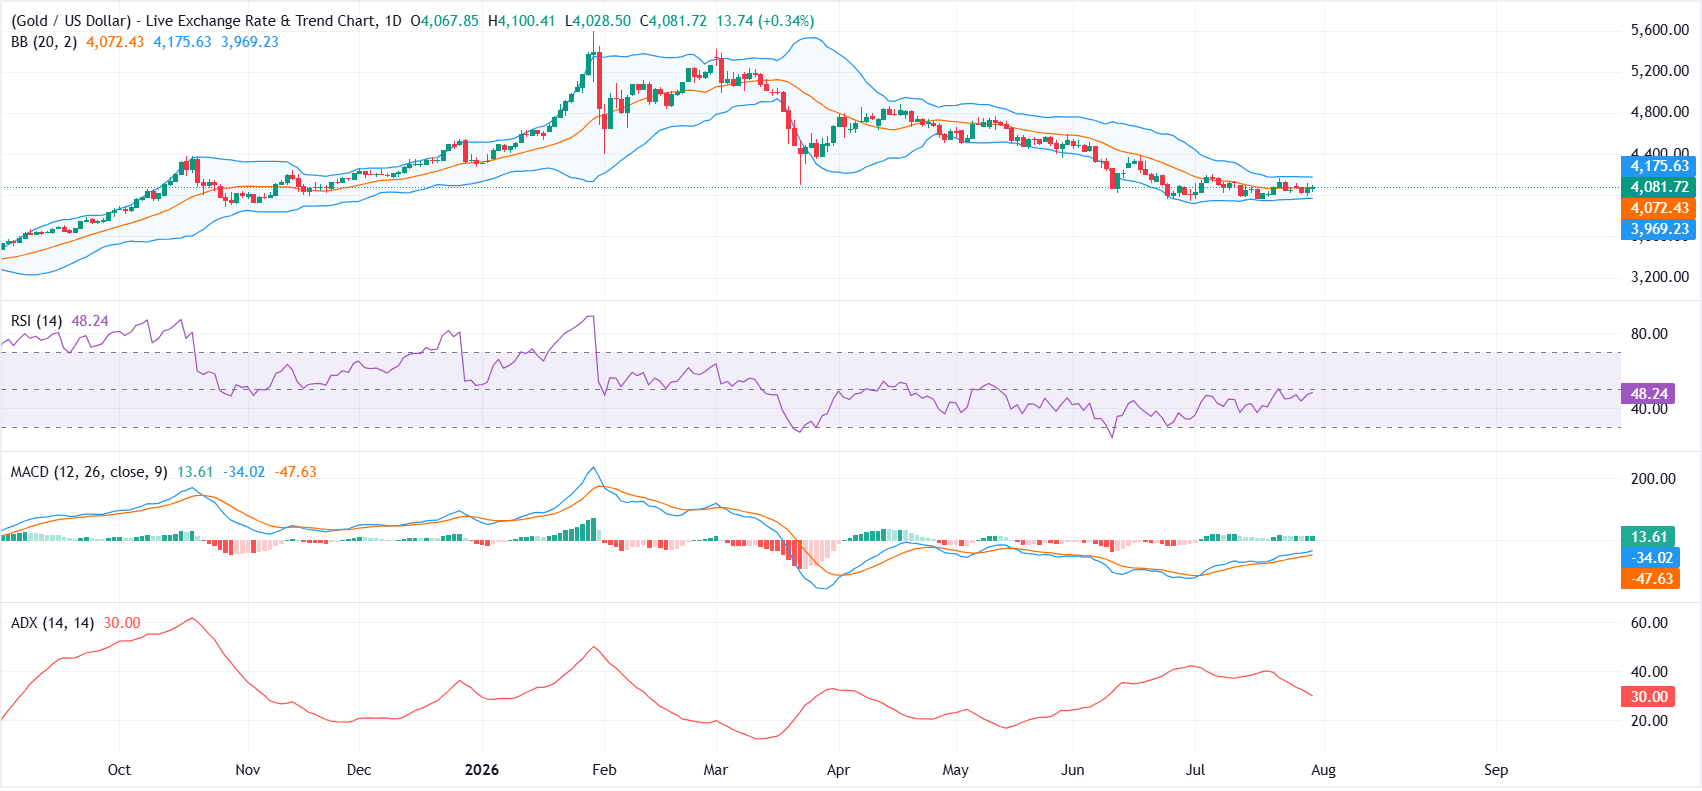
On the daily chart, XAU/USD remains locked within the $4,000-$4,200 range, hovering around the 20-day Simple Moving Average (SMA), the Bollinger middle band, near $4,072. This keeps the short-term outlook neutral and points to a lack of clear directional momentum.
The Relative Strength Index (RSI) at 48 sits just below neutral, and the Moving Average Convergence Divergence (MACD) remains positive, together suggesting a constructive but not overstretched recovery within a moderately trending backdrop indicated by an Average Directional Index (ADX) reading of 30.
On the downside, the psychological $4,000 mark remains the key support holding the range together. A sustained break below this level would expose the Bollinger lower band near $3,969 and signal a possible bearish breakout.
On the upside, the Bollinger upper band near $4,175 offers initial resistance, followed by the upper boundary of the range at $4,200. A daily close above $4,200 would be needed to confirm a bullish breakout and open the door to further gains.
(The technical analysis of this story was written with the help of an AI tool. Know more.)
Inflation FAQs
Inflation measures the rise in the price of a representative basket of goods and services. Headline inflation is usually expressed as a percentage change on a month-on-month (MoM) and year-on-year (YoY) basis. Core inflation excludes more volatile elements such as food and fuel which can fluctuate because of geopolitical and seasonal factors. Core inflation is the figure economists focus on and is the level targeted by central banks, which are mandated to keep inflation at a manageable level, usually around 2%.
The Consumer Price Index (CPI) measures the change in prices of a basket of goods and services over a period of time. It is usually expressed as a percentage change on a month-on-month (MoM) and year-on-year (YoY) basis. Core CPI is the figure targeted by central banks as it excludes volatile food and fuel inputs. When Core CPI rises above 2% it usually results in higher interest rates and vice versa when it falls below 2%. Since higher interest rates are positive for a currency, higher inflation usually results in a stronger currency. The opposite is true when inflation falls.
Although it may seem counter-intuitive, high inflation in a country pushes up the value of its currency and vice versa for lower inflation. This is because the central bank will normally raise interest rates to combat the higher inflation, which attract more global capital inflows from investors looking for a lucrative place to park their money.
Formerly, Gold was the asset investors turned to in times of high inflation because it preserved its value, and whilst investors will often still buy Gold for its safe-haven properties in times of extreme market turmoil, this is not the case most of the time. This is because when inflation is high, central banks will put up interest rates to combat it. Higher interest rates are negative for Gold because they increase the opportunity-cost of holding Gold vis-a-vis an interest-bearing asset or placing the money in a cash deposit account. On the flipside, lower inflation tends to be positive for Gold as it brings interest rates down, making the bright metal a more viable investment alternative.
Recommended Articles


