


Ripple XRP Price Forecast: XRP holds support, but weak on-chain activity caps gains
- XRP hovers above $1.05 support while bulls struggle to extend gains.
- XRP’s weak on-chain activity, reflected in the Network Growth and Active Addresses metrics, weighs on price action.
- XRP’s technical outlook remains weak, marked by subdued momentum indicators and falling major moving averages.
Ripple (XRP) shows subtle signs of recovery above $1.05 on Tuesday, with the move to around $1.07 ending three straight days of losses amid a pressured broader cryptocurrency market.
Escalating war between the United States (US) and Iran has weighed on sentiment since last weekend, with both parties exchanging attacks, while shipping through the Strait of Hormuz has stopped and the US has reinstated the blockade of Iranian ports.
Subdued on-chain activity lags XRP recovery
Interest in XRP remains significantly suppressed, as evidenced by on-chain indicators. According to Santiment data, newly created addresses on the XRP Ledger (XRPL) have eased to roughly 800 on Tuesday, down from approximately 2,000 the previous day. Looking back, users joining the network peaked at 6,600 on June 30, suggesting that appetite for risk assets is cooling. If the drop is sustained, demand for XRP would narrow further, limiting potential recovery.
 [14-1784031060350.32.47, 14 Jul, 2026].png)
Addresses actively transacting on the protocol paint a similarly grim picture, declining to roughly 2,200 on Tuesday, down from approximately 4,000 the day before. This drawdown shows that fewer users are actively sending and receiving assets on the XRPL. An extended decline means less on-chain demand and a reduced tailwind to sustain the current mild rebound.
 [14-1784031080098.32.54, 14 Jul, 2026].png)
Price analysis: XRP defends vital support, gains still capped
XRP retains a bearish near-term tone despite a slight increase above $1.07 from the psychological support at $1.05. Still, the spot price holds below the 50-day, 100-day and 200-day Exponential Moving Averages (EMAs).
The Parabolic SAR support at $1.04, suggests some underlying demand, but the broader structure remains capped by the downward resistance trendline whose break price sits at $1.11. While the Moving Average Convergence Divergence (MACD) histogram is fading but slightly positive on the daily chart, the Relative Strength Index (RSI) at 40 hints that upside momentum is still limited and rallies are vulnerable below the major EMAs.
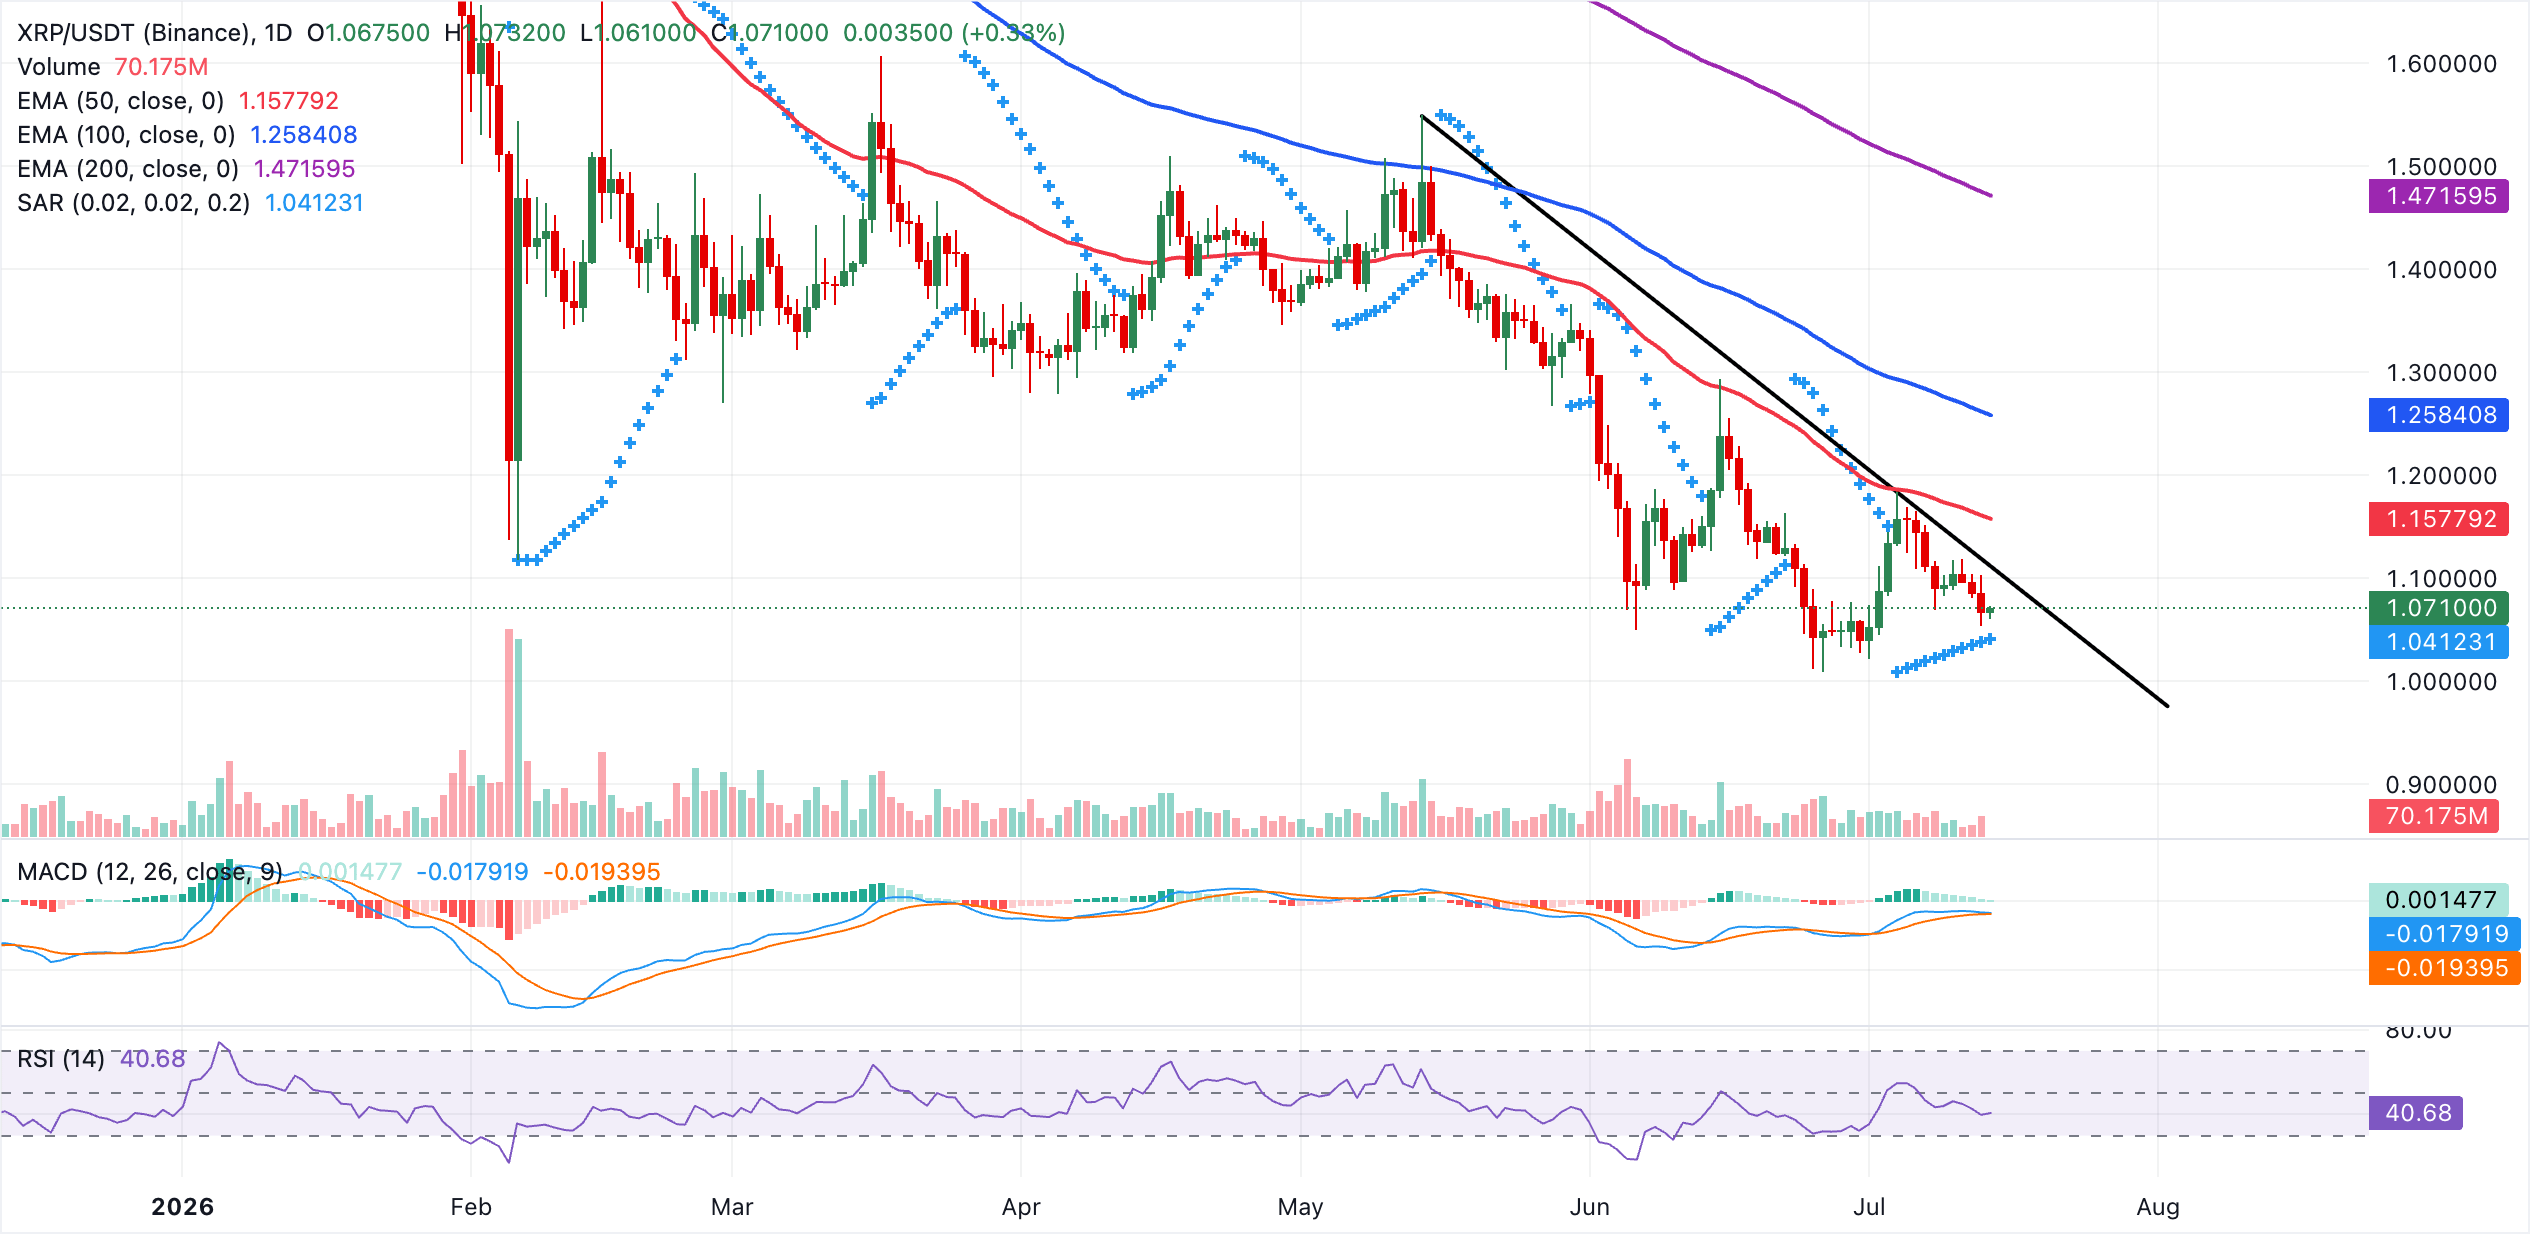
Initial resistance is seen at the downward resistance trendline break level at $1.11, ahead of the 50-day EMA barrier at $1.16, with the 100-day EMA at $1.26 and the distant 200-day EMA at $1.47 reinforcing a broader supply zone if recovery extends.
On the flip side, immediate support is offered by the Parabolic SAR level at $1.04. A daily close below this floor would likely open the door to a deeper pullback, keeping the pair entrenched in its bearish bias as long as it trades beneath the clustered EMAs overhead.
(The technical analysis of this story was written with the help of an AI tool. Know more.)
Cryptocurrency metrics FAQs
The developer or creator of each cryptocurrency decides on the total number of tokens that can be minted or issued. Only a certain number of these assets can be minted by mining, staking or other mechanisms. This is defined by the algorithm of the underlying blockchain technology. On the other hand, circulating supply can also be decreased via actions such as burning tokens, or mistakenly sending assets to addresses of other incompatible blockchains.
Market capitalization is the result of multiplying the circulating supply of a certain asset by the asset’s current market value.
Trading volume refers to the total number of tokens for a specific asset that has been transacted or exchanged between buyers and sellers within set trading hours, for example, 24 hours. It is used to gauge market sentiment, this metric combines all volumes on centralized exchanges and decentralized exchanges. Increasing trading volume often denotes the demand for a certain asset as more people are buying and selling the cryptocurrency.
Funding rates are a concept designed to encourage traders to take positions and ensure perpetual contract prices match spot markets. It defines a mechanism by exchanges to ensure that future prices and index prices periodic payments regularly converge. When the funding rate is positive, the price of the perpetual contract is higher than the mark price. This means traders who are bullish and have opened long positions pay traders who are in short positions. On the other hand, a negative funding rate means perpetual prices are below the mark price, and hence traders with short positions pay traders who have opened long positions.
Recommended Articles


