


Solana Price Forecast: Steady ETF inflows and improving derivatives metrics support recovery hopes
- Solana price trades in red on Wednesday, extending its correction that began last week.
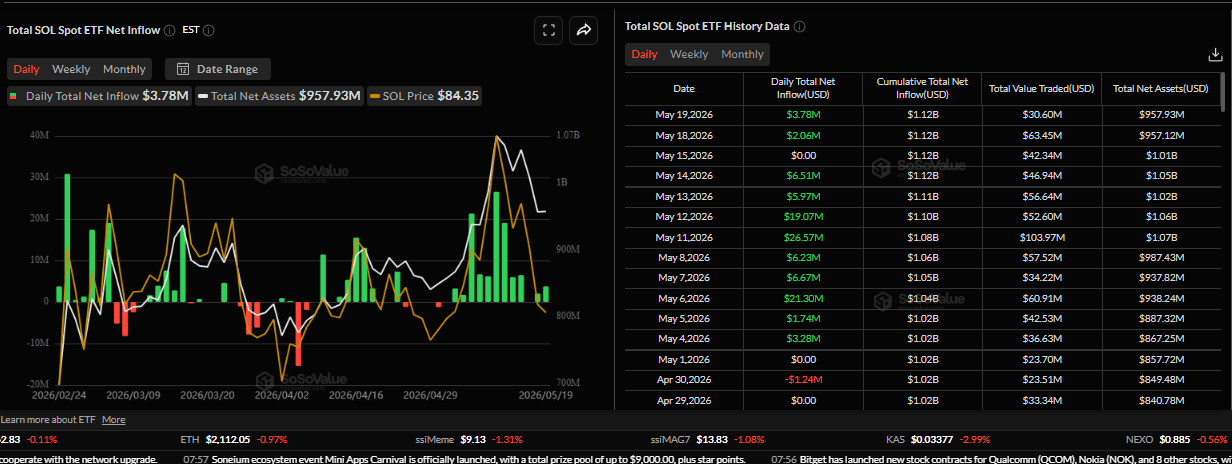
- US-listed spot ETFs recorded an inflow of $3.78 million on Tuesday, marking the second consecutive day of positive flow.
- Derivatives data supports mild bullish sentiment with funding rates turning positive and short positions declining among traders.
Solana (SOL) price trades below $85 on Wednesday, extending its pullback following last week’s correction. Despite the recent price pullback, institutional demand appears to be stabilizing, with spot Exchange Traded Funds (ETFs) recording their second day of positive flows so far this week. Meanwhile, improving derivatives metrics also suggests SOL could recover in the coming days.
Institutional demand remains steady
Institutional demand for SOL remains strong despite its price correction. SoSoValue data showed that spot Solana ETFs recorded inflows of $3.78 million on Tuesday, following inflows of $2.06 million on Monday. This inflow trend has been steady since early May, and if it continues into the latter half of this week, SOL could see a recovery.
Improving derivatives traders’ sentiment
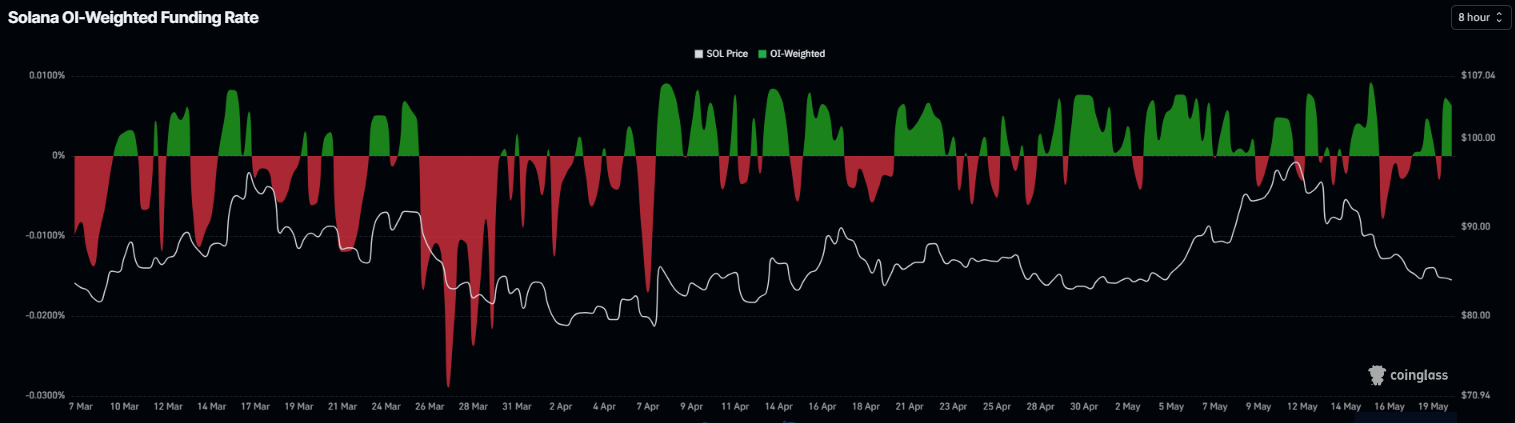
On the derivatives side, metrics support a mild bullish bias. Solana’s funding rates flipped positive on Tuesday and surge to 0.0063% on Wednesday, indicating that longs are paying shorts. Historically, as shown in the chart below, when the funding rates have flipped from negative to positive and risen, the SOL price has rallied.
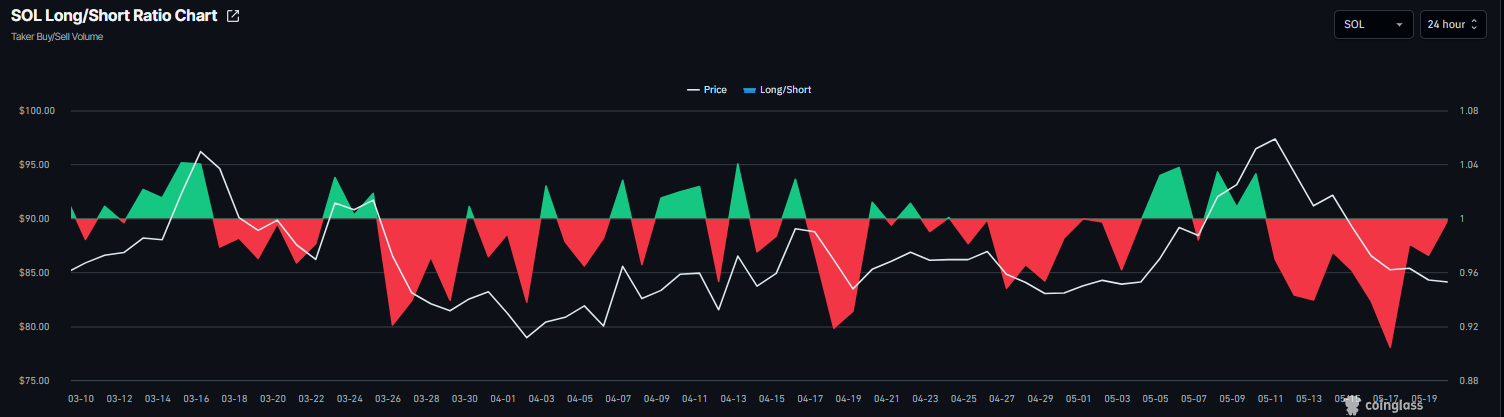
CoinGlass’ long-to-short ratio for SOL rebounds to 0.99 on Wednesday, nearing the positive territory after reaching the lowest level in over a month on Sunday. If the ratio flips above 1, it indicates bullish sentiment, as more traders are betting on the asset’s price to rise.
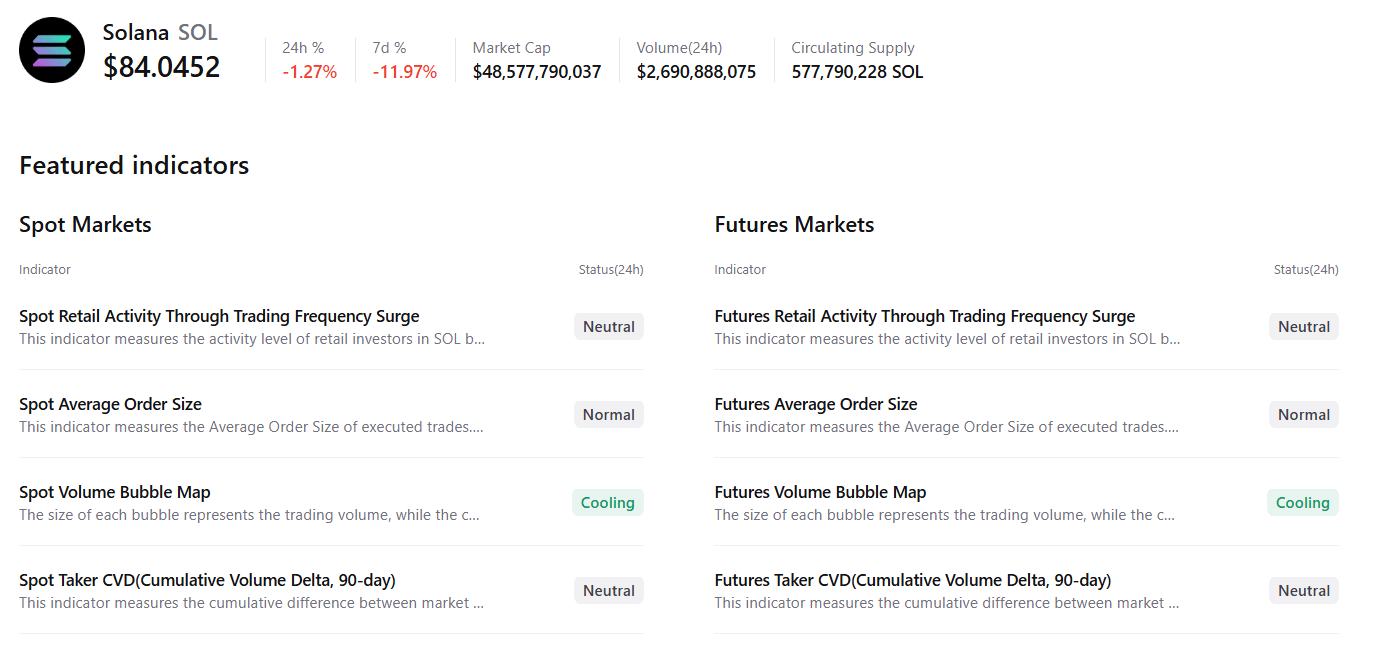
CryptoQuant’s summary data also shows neutral to mild positive sentiment as spot and futures markets show cooling conditions with largely neutral sentiment on other metrics, hinting at a possible recovery ahead.
Solana Price Forecast: Bears still have steam for a price correction
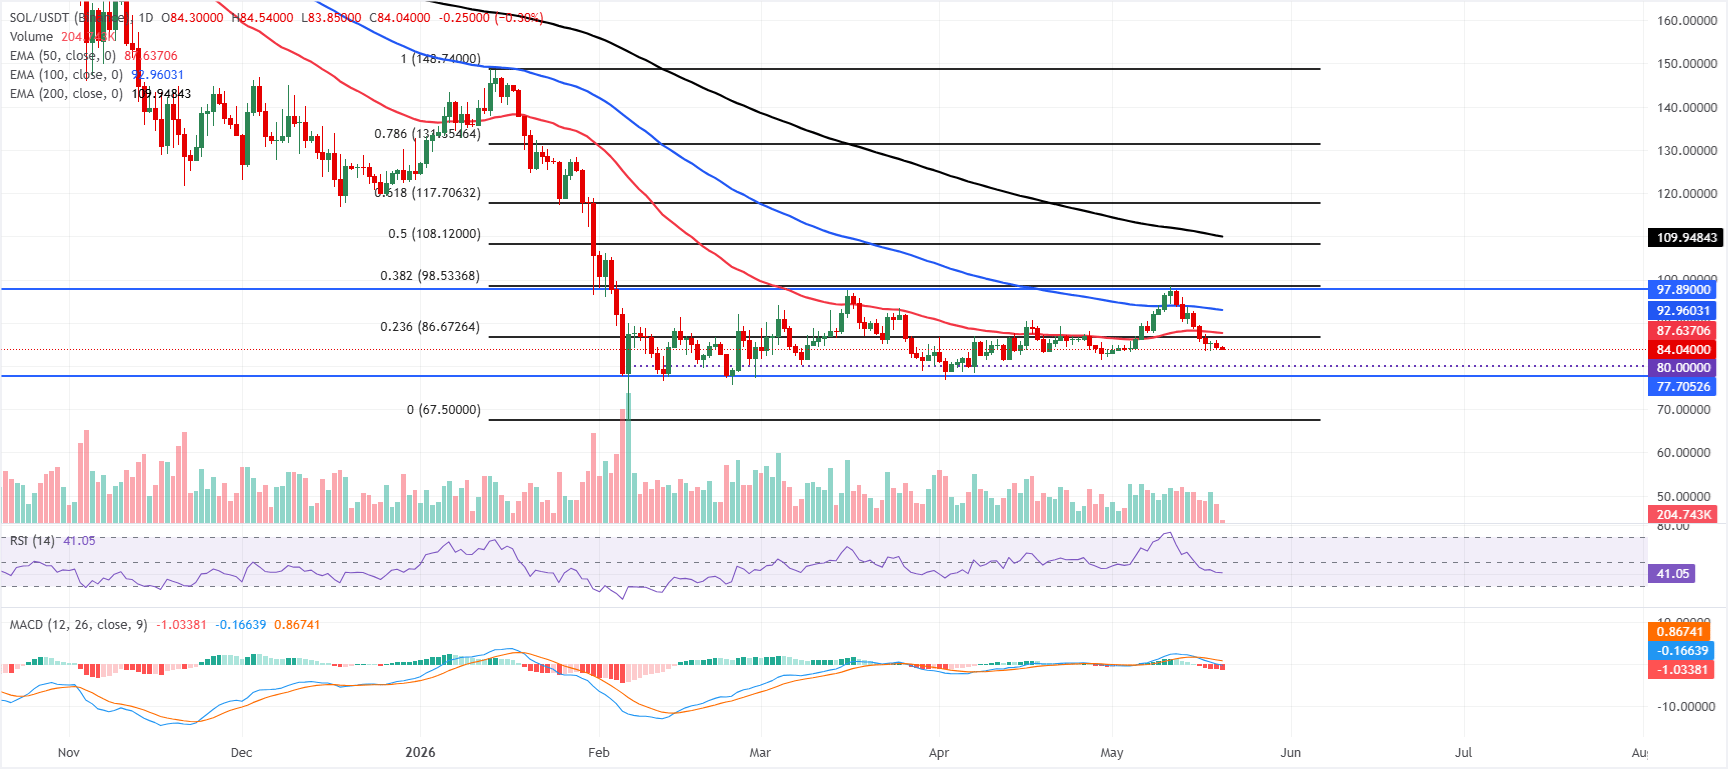
Solana price trades at $84.04 on Wednesday, keeping a corrective tone as it holds below the short- and medium-term exponential moving averages (EMAs). The 23.6% Fibonacci retracement at $86.67 and the 50-day EMA at $87.64 form immediate overhead supply, reinforcing the bearish bias as long as price remains capped beneath them.
The 100-day EMA at $92.96 and the horizontal resistance further up at $97.89 add to a broader resistance band. At the same time, a subdued Relative Strength Index (RSI) near 41 and a negative, falling Moving Average Convergence Divergence (MACD) histogram hint that downside momentum still dominates.
On the downside, initial support is seen at the horizontal level around $77.71, ahead of the Fibonacci anchor near $67.50, which marks a more distant structural floor. As long as SOL stays under the $86.67–$87.64 resistance cluster, rallies are likely to be sold into, and only a sustained break above the 100-day EMA at $92.96 would start to ease the current bearish pressure and open the way toward the $97.89–$98.53 resistance zone.
(The technical analysis of this story was written with the help of an AI tool.)
Recommended Articles


