


Gold Price Forecast: Expectations of Easing US-Iran Tensions May Lift Gold to $4,350
TradingKey - Spot Gold ( XAUUSD) rose above $4,200 at one point during Wednesday's intraday trading. While digesting a significant slowdown in US private-sector hiring, the market also focused on expectations of an easing in the Strait of Hormuz shipping dispute, with both factors amplifying short-term volatility in the precious metals market.
ADP data showed that US private-sector employment, excluding the government sector, added only 44,000 seasonally adjusted jobs in July, marking the smallest increase since January this year. This fell short of the market expectation of 70,000 and was lower than the downwardly revised 95,000 in June.
The market expects non-farm payrolls in July to rebound to 83,000 from 57,000 in June, while the unemployment rate may rise slightly to 4.3%. This will serve as a key macroeconomic variable determining whether gold can sustain its short-term strength.
On the geopolitical front, US President Trump stated that the Strait of Hormuz will open very soon. Speaking of contacts with Iran, Trump said: "Our talks are going very well. The Iranian side is reluctant to admit it, which you know is a bit embarrassing. You just say publicly that we had a great talk, and then someone on the Iranian side jumps out and says, 'We haven't met at all.' This is pure falsehood. They actually want to make a deal."
In addition, according to the Associated Press, two regional officials stated that negotiators from Iran and Oman have agreed on a draft agreement, which is awaiting final approval from Iran's Supreme Leader. This potential agreement aims to temporarily resolve the US-Iran dispute over shipping in the Strait of Hormuz and pave the way for restarting nuclear talks.
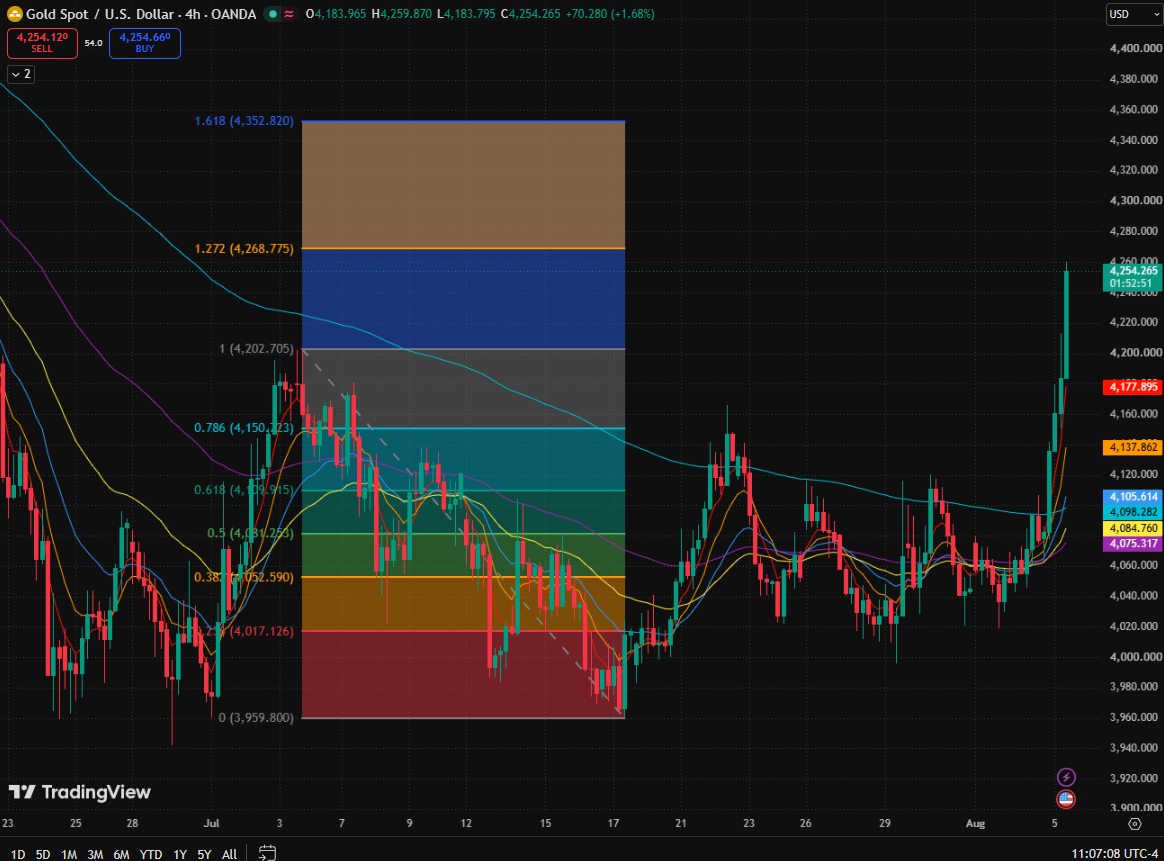
Spot Gold Price Chart, Source: TradingView
From the 4-hour candlestick chart, after repeatedly consolidating within the $4,040–$4,120 range, gold prices surged rapidly, breaking above the upper boundary of the recent consolidation platform and several short-to-medium-term moving averages, and climbing above the key previous high of $4,202.71. Short-term bulls have regained the initiative, and the trend has shifted from consolidation to accelerated upward movement. However, the short-term deviation from the moving averages has also widened, and attention should be paid to whether the price can stabilize after the breakout rather than pulling back quickly.
The primary short-term support is located at $4,202.71. If it holds firm upon a pullback, it will help confirm the validity of the breakout. Further support is seen at $4,150.23, corresponding to the 0.786 retracement level; if this level is lost, attention should turn to the moving average and Fibonacci support zone between $4,109.92 and $4,081.25.
On the upside, if gold prices remain above $4,202.71, the next target is the 1.272 Fibonacci extension level at $4,268.78, with a further upside target at the 1.618 extension level of $4,352.82.
Recommended Articles


