


EUR/USD Price Forecast: Range-bound trade persists below 100-day SMA
- EUR/USD remains range-bound as the 100-day SMA keeps buyers in check.
- RSI and MACD readings point to a mild bullish bias despite the sideways price action.
- A break above the 100-day SMA would bring the 200-day SMA into focus.
EUR/USD fluctuates on Tuesday, holding within the range seen over the past week. At the time of writing, the pair trades around 1.1546, virtually unchanged on the day.
The sideways price action comes as the US Dollar (USD) stabilizes near its recent lows, with traders closely monitoring developments in the Middle East, particularly around the reopening of the Strait of Hormuz.
Attention also turns to Wednesday’s US Consumer Price Index (CPI) data, which could shape Federal Reserve (Fed) rate expectations for the September meeting and drive the next move in the US Dollar and, in turn, EUR/USD.
Euro seen grinding higher as Fed independence erodes and Dollar overvaluation unwinds
According to Commerzbank, the EUR/USD exchange rate is likely to regain traction once geopolitical tensions ease, with the bank arguing that "the EUR/USD exchange rate should rise again after the war ends and continue to drift higher in the following quarters due to the eroding independence of the U.S. Federal Reserve, especially since the dollar is significantly overvalued in terms of purchasing power parity." The bank also highlights the policy-rate backdrop, stating that "we expect US interest rate expectations to correct even further downward in the coming months, weighing on the dollar."
Reflecting these factors, the bank has trimmed but maintained a constructive medium‑term profile for the pair, now projecting that “we expect the EUR/USD rate to be 1.18 by mid-2027 (previously 1.20)” and, “all in all, we expect a gradual rise in EUR-USD toward 1.19 by the end of 2027 (previous forecast: 1.21).”
Technical analysis: Daily chart
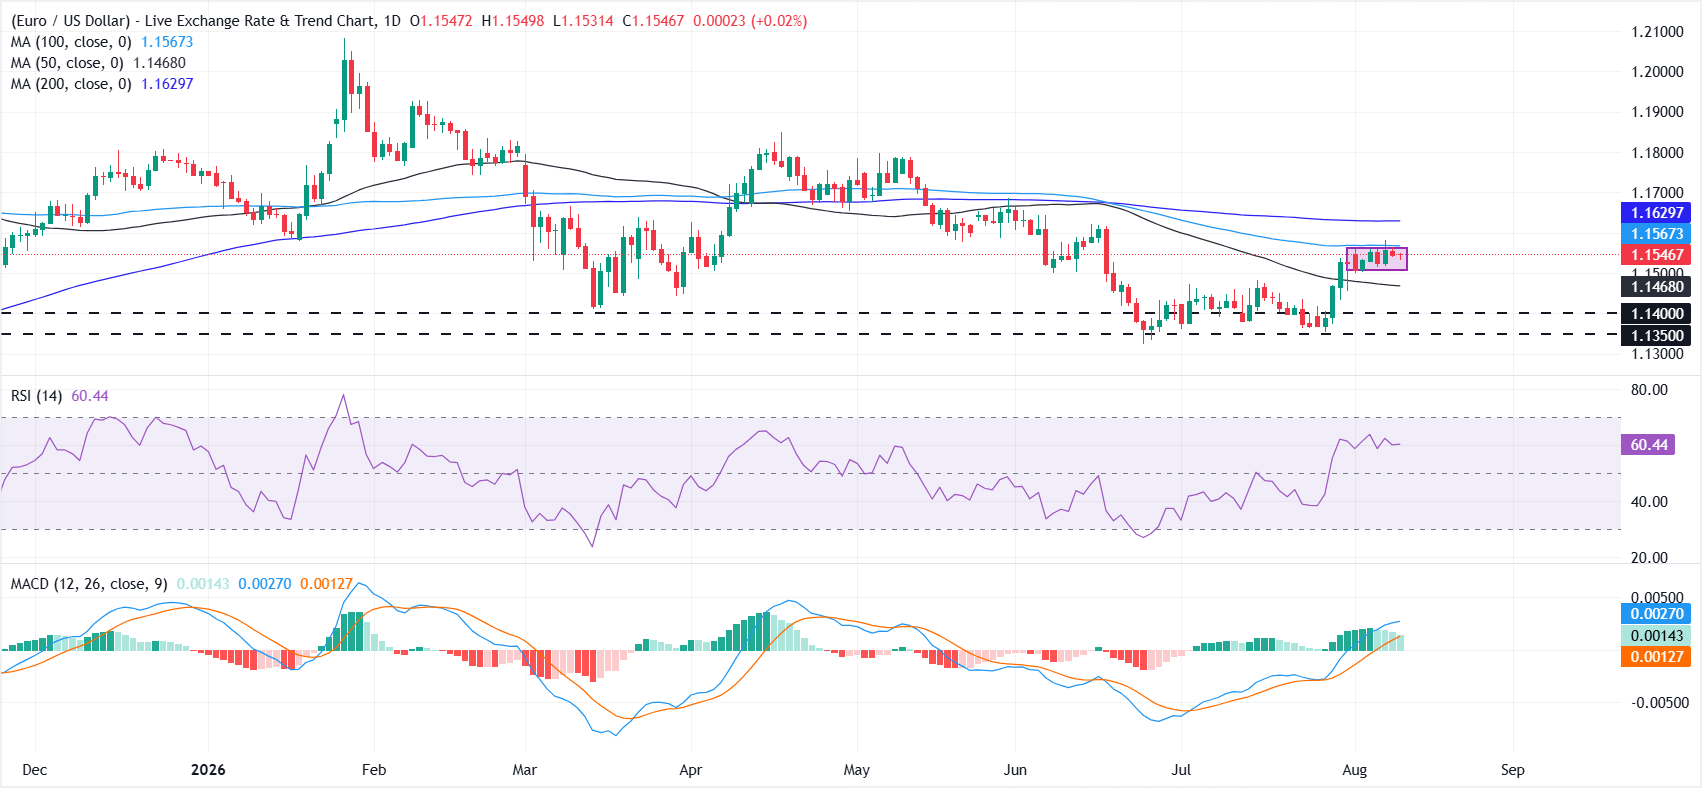
EUR/USD is hovering between the short- and longer-term moving averages and thus maintaining a neutral near-term bias. Momentum remains constructive, with the Relative Strength Index (RSI) on the daily chart near 59 hinting at persistent buying interest and the Moving Average Convergence Divergence (MACD) line in positive territory, suggesting a mild bullish tone in the backdrop despite the layered resistance above price.
On the downside, initial support is seen at the 50-day SMA at 1.1468, followed by a horizontal floor at 1.1400 and a deeper structural base near 1.1350.
On the topside, immediate resistance is located at the 100-day SMA at 1.1567, with a more significant barrier at the 200-day SMA at 1.1630. A sustained break above these levels would be needed to unlock a more convincing bullish phase, while failure to do so would keep the pair confined within its current range.
(The technical analysis of this story was written with the help of an AI tool. Know more.)
US Dollar Price Today
The table below shows the percentage change of US Dollar (USD) against listed major currencies today. US Dollar was the strongest against the British Pound.
| USD | EUR | GBP | JPY | CAD | AUD | NZD | CHF | |
|---|---|---|---|---|---|---|---|---|
| USD | -0.02% | 0.02% | -0.06% | -0.02% | -0.22% | -0.08% | -0.02% | |
| EUR | 0.02% | 0.04% | -0.04% | 0.01% | -0.16% | -0.06% | 0.00% | |
| GBP | -0.02% | -0.04% | -0.09% | -0.04% | -0.21% | -0.10% | -0.04% | |
| JPY | 0.06% | 0.04% | 0.09% | 0.05% | -0.14% | -0.02% | 0.06% | |
| CAD | 0.02% | -0.01% | 0.04% | -0.05% | -0.18% | -0.07% | -0.00% | |
| AUD | 0.22% | 0.16% | 0.21% | 0.14% | 0.18% | 0.11% | 0.18% | |
| NZD | 0.08% | 0.06% | 0.10% | 0.02% | 0.07% | -0.11% | 0.07% | |
| CHF | 0.02% | -0.01% | 0.04% | -0.06% | 0.00% | -0.18% | -0.07% |
The heat map shows percentage changes of major currencies against each other. The base currency is picked from the left column, while the quote currency is picked from the top row. For example, if you pick the US Dollar from the left column and move along the horizontal line to the Japanese Yen, the percentage change displayed in the box will represent USD (base)/JPY (quote).
Recommended Articles


