


NZD/USD Price Forecast: Previous highs around 0.5860 are holding bears for now
- NZD/USD pulled back from eight-week highs at 0.5885 but remains above previous highs, at 0.5860.
- The Kiwi is on track for a nearly 1.5% weekly rally, buoyed by the US Dollar's weakness following the Fed's monetary policy meeting.
- The pair is in a corrective pullback after reaching overbought levels on intraday RSI.
The New Zealand Dollar (NZD) ticks lower against the US Dollar (USD) on Friday, but remains steady near eight-week highs at 0.5885, with downside attempts contained above a previous resistance area at 0.5860 so far.
The Kiwi Dollar has rallied nearly 1.5% this week, boosted by a weak USD after the Federal Reserve’s (Fed) monetary policy meeting on Wednesday. The US central bank left its Federal Funds Rate unchanged at the 3.50%-3.75% range, as expected, but the lack of guidance shown by Chairman Warsh was taken by the market as a dovish sign, and sent the USD tumbling against its main peers.
Kiwi bulls have lost some momentum on Friday, as Chinese NBS Manufacturing Purchasing Managers Index (PMI) figures showed that business activity contracted unexpectedly in July, weighed by weak domestic demand and the disruptive impact of typhoons. China is New Zealand’s major trading partner and the NZD is closely correlated to Chinese economic growth.
Technical Analysis: Correcting lower within a bullish trend
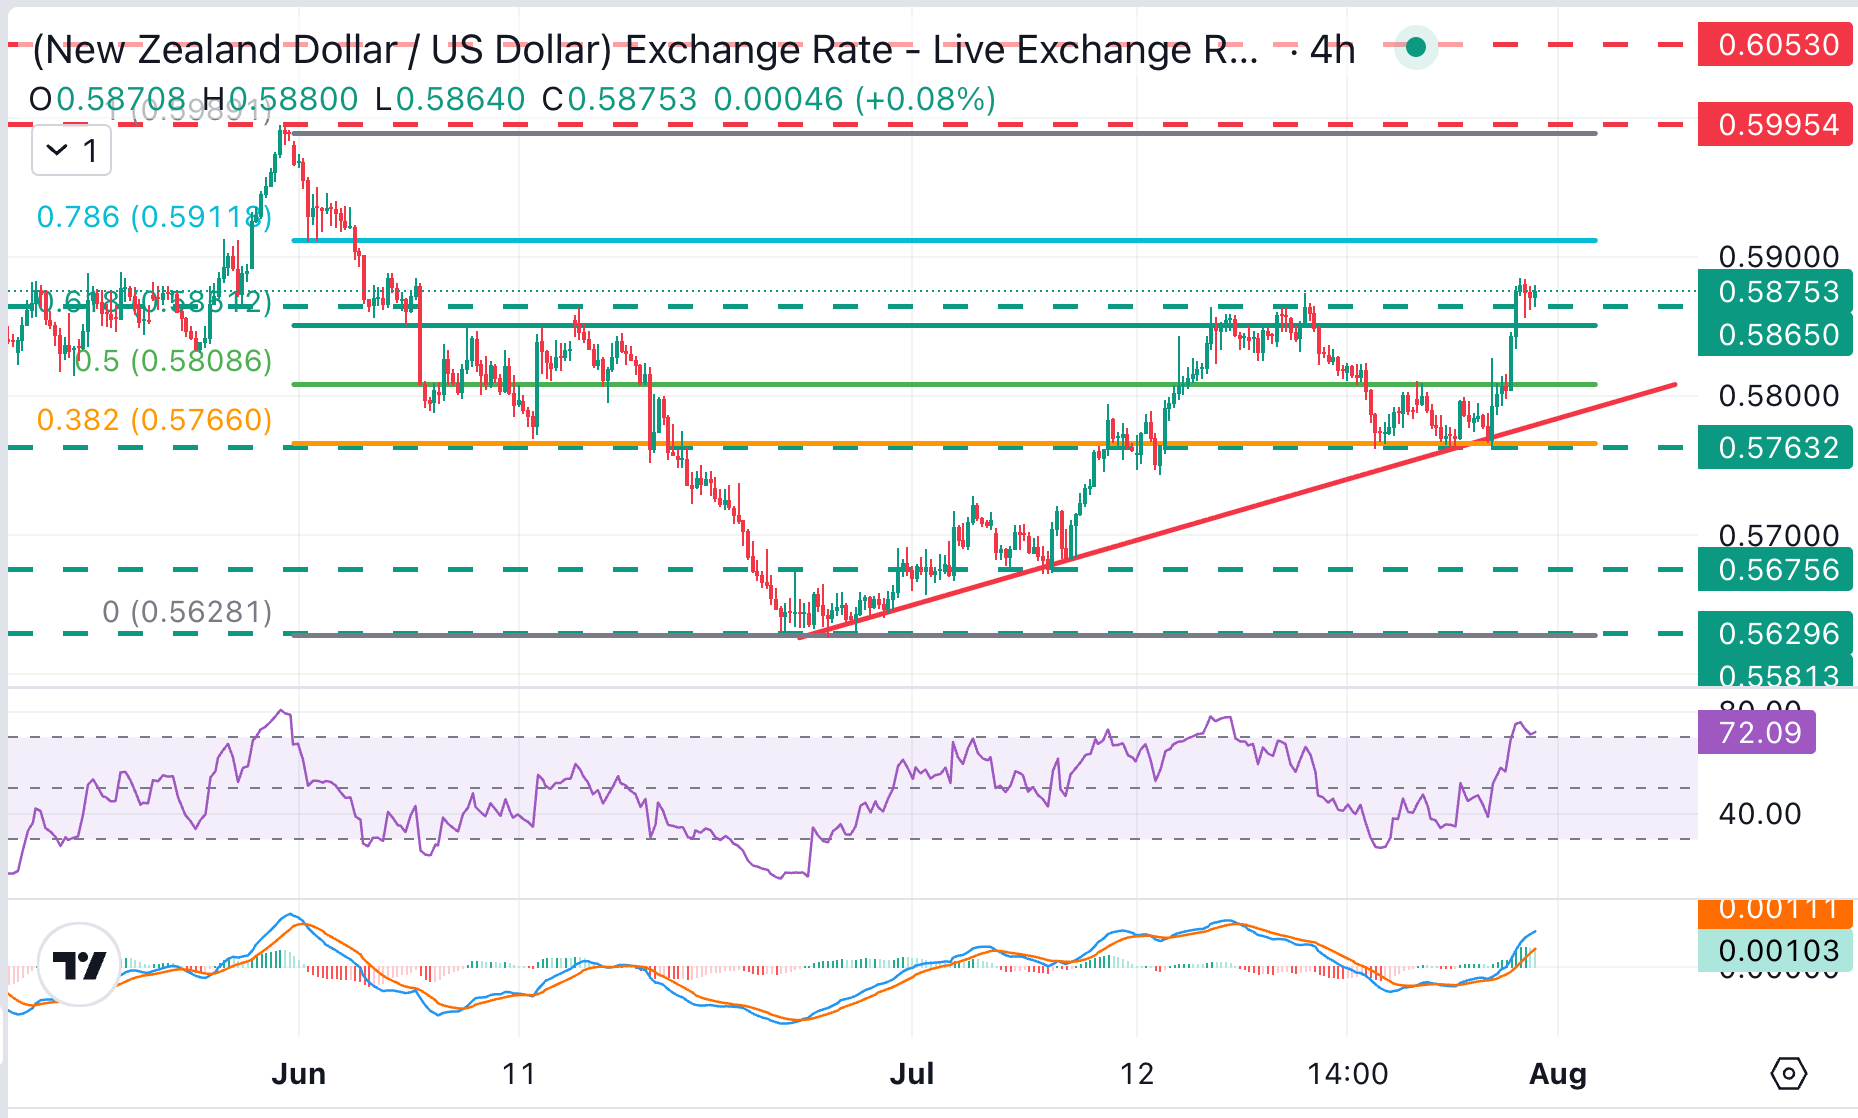
NZD/USD trades at 0.5875, keeping a constructive near-term bias although the overbought Relative Strength Index (RSI) levels suggest that the pair is ripe for a deeper correction. The 4-Hour RSI remains above 70, hinting at a stretched condition, while the Moving Average Convergence Divergence (MACD) remains above its signal line, which suggests that upside pressure is still intact.
A sharper reversal below the mid-July highs in the mentioned 0.5860 level is likely to find support in the area between the ascending trendline from June 25 lows, now at 0.5785, and the July 23, 27 and 29 lows, around 0.5865. On the topside, above Thursday's highs at 0.5885, bulls might find resistance at the 78.6% Fibonacci retracement of the June sell-off, at 0.5911 ahead of June's peak, in the 0.6000 area.
(The technical analysis of this story was written with the help of an AI tool. Know more.)
New Zealand Dollar Price This week
The table below shows the percentage change of New Zealand Dollar (NZD) against listed major currencies this week. New Zealand Dollar was the strongest against the US Dollar.
| USD | EUR | GBP | JPY | CAD | AUD | NZD | CHF | |
|---|---|---|---|---|---|---|---|---|
| USD | -1.09% | -0.91% | -1.99% | -0.52% | -0.51% | -1.22% | -1.16% | |
| EUR | 1.09% | 0.15% | -0.92% | 0.60% | 0.60% | -0.14% | -0.07% | |
| GBP | 0.91% | -0.15% | -1.19% | 0.44% | 0.44% | -0.29% | -0.23% | |
| JPY | 1.99% | 0.92% | 1.19% | 1.49% | 1.51% | 0.77% | 0.75% | |
| CAD | 0.52% | -0.60% | -0.44% | -1.49% | -0.02% | -0.71% | -0.65% | |
| AUD | 0.51% | -0.60% | -0.44% | -1.51% | 0.02% | -0.73% | -0.67% | |
| NZD | 1.22% | 0.14% | 0.29% | -0.77% | 0.71% | 0.73% | 0.06% | |
| CHF | 1.16% | 0.07% | 0.23% | -0.75% | 0.65% | 0.67% | -0.06% |
The heat map shows percentage changes of major currencies against each other. The base currency is picked from the left column, while the quote currency is picked from the top row. For example, if you pick the New Zealand Dollar from the left column and move along the horizontal line to the US Dollar, the percentage change displayed in the box will represent NZD (base)/USD (quote).
Recommended Articles


