


BNB (BNBUSD) Fluctuated Significantly on Oct 27: Key Variables Behind the Move
BNB (BNBUSD) is up 1.58% at Oct 27 11:25(ET), now at $750.9, with a 7-day up of 1.68%.
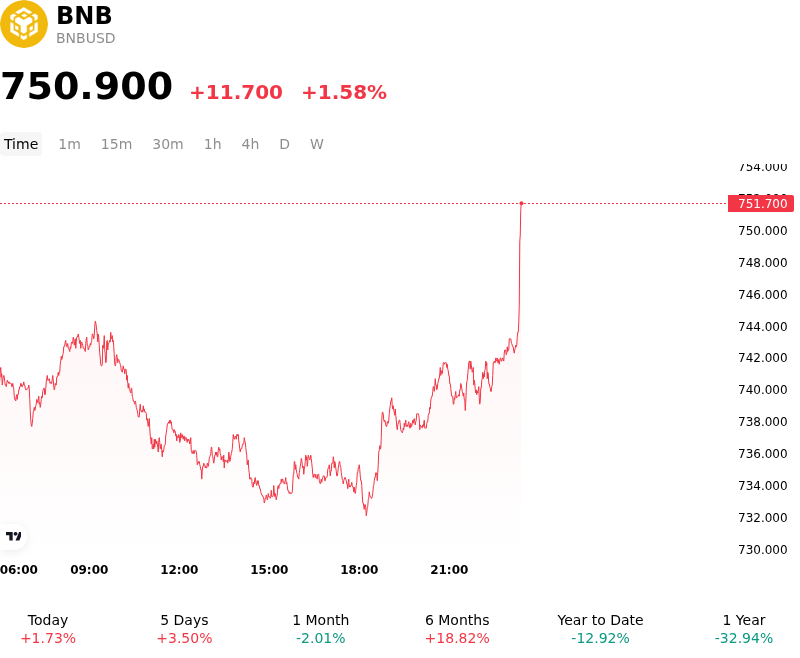
What is driving BNB (BNBUSD)’s stock price up today?
BNB demonstrated counter-trend resilience and positive price momentum as capital rotated into the asset following structural developments in corporate digital asset treasury management. The primary catalyst driving market sentiment was the Nasdaq debut of BNB Standard, a corporate vehicle focused on acquiring and holding BNB ecosystem assets. This institutional milestone, marked by high-profile ecosystem leadership participation on Wall Street, catalyzed a structural revaluation of BNB's asset class status. Market expectations shifted toward sustained corporate treasury accumulation and recurring validator staking yield, encouraging spot buying and liquidity absorption that allowed the asset to outperform the broader digital asset space.
Ecosystem fundamentals and supply-side dynamics provided additional momentum for the upward move. The structural reduction in circulating supply following the completion of the network's 37th quarterly token burn continued to tighten floating liquidity. Concurrently, investor sentiment was bolstered by strategic initiatives positioning the BNB Smart Chain as a primary settlement layer for emerging decentralized artificial intelligence compute networks and micro-payments. This reinforced the long-term utility narrative of the native token, attracting institutional allocators seeking relative stability and rotational capital departing consolidating mega-cap assets.
From a positioning and macroeconomic perspective, the move reflected short covering and disciplined spot demand amid a cautious broader market environment. Ahead of the Federal Reserve's monetary policy announcement, global risk sentiment remained constrained by elevated benchmark yields. However, strong underlying order-book depth allowed BNB to absorb macro-driven headwinds and break above near-term consolidation hubs. Derivatives positioning indicated a clean turn in open interest as leveraged short positions were unwound into spot liquidity. Going forward, institutional market participants continue to monitor global monetary policy trajectories, regulatory oversight surrounding exchange-linked ecosystems, and the pace of institutional corporate treasury execution.
Technical Analysis of BNB (BNBUSD)
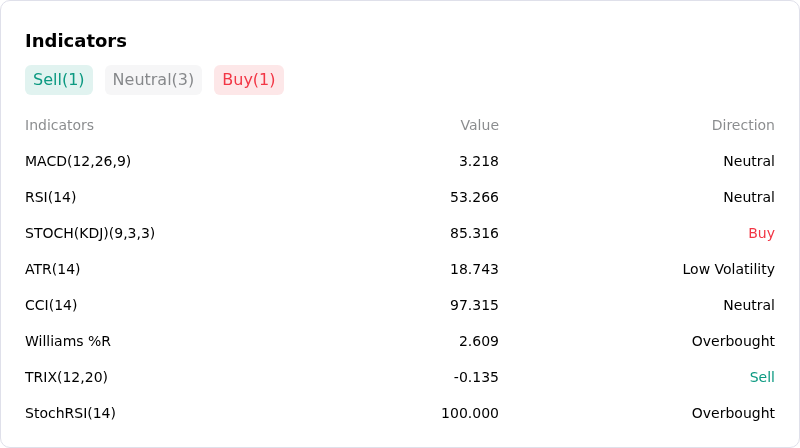
Technically, BNB (BNBUSD) shows a MACD (12,26,9) value of 3.218, indicating a neutral signal. The RSI at 53.266 suggests neutral condition and the Williams %R at 2.609 suggests overbought condition. Please monitor closely.
More details about BNB (BNBUSD)
Recent Events and Risks:
- Derivatives Over-Leverage and Long Liquidation Exposure: Elevated perpetual swap open interest relative to spot buying volume leaves BNB highly vulnerable to automated long-liquidation cascades during minor intraday pullbacks.
- Technical Overhead Resistance Rejection: BNB price action has encountered repeated rejections near the critical $745–$750 resistance level, with technical indicators like the MACD printing sell signals and heightening the threat of a technical breakdown toward $700 support.
- On-Chain Whale Inflows and Dump Risk: On-chain tracking shows large BNB transfers from whale wallets into centralized exchange deposit addresses to cover underwater positions, creating immediate sell-side liquidity pressure and supply overhang.
- Regulatory Compliance Drag and Exchange Scrutiny: Ongoing regulatory investigations into Binance and compliance hurdles—such as European Union MiCA implementation—continue to maintain elevated platform risk premiums and suppress institutional demand for BNB ecosystem assets.
Recommended Articles


