


USD/JPY (USDJPY) Surges on Oct 1: Was It the Dollar, Rates, or Data?
USD/JPY (USDJPY) is up 0.51% at Oct 1 21:55(ET), now at $158.191, with a 7-day down of 0.41%.
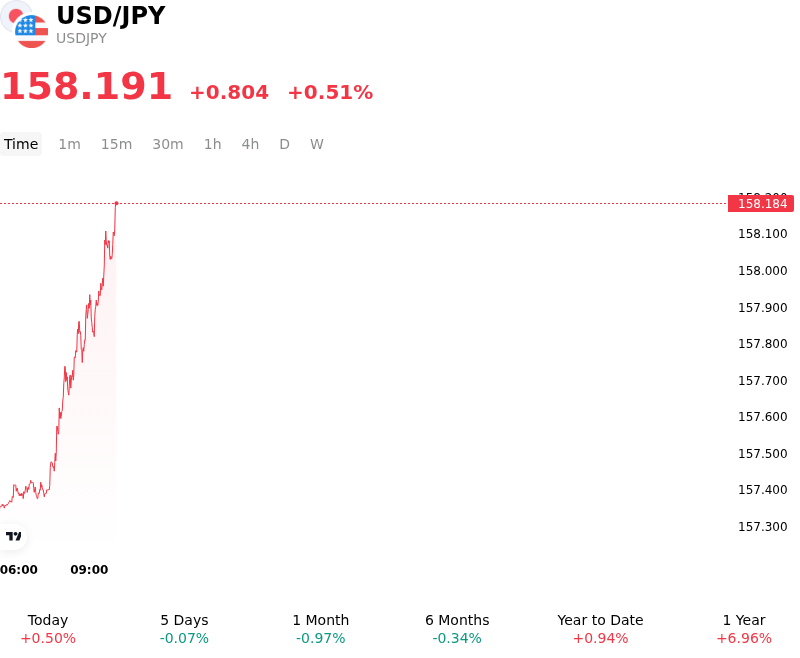
What is driving USD/JPY (USDJPY)’s stock price up today?
The upside move in USDJPY was primarily driven by resilient U.S. economic indicators that reinforced expectations of sustained U.S. economic strength, pushing U.S. Treasury yields higher relative to Japanese government bonds. The release of robust U.S. manufacturing activity data, alongside steady labor market signals, reassured institutional investors regarding the underlying momentum of the American economy. As a result, U.S. yields advanced across the curve, widening the interest-rate differential in favor of the greenback and stimulating demand for the dollar against low-yielding funding currencies.
On the Japanese side, domestic economic inputs provided a mixed backdrop that failed to generate sustained demand for the yen. While the Bank of Japan’s quarterly Tankan survey highlighted ongoing business optimism and steady capital expenditure plans, the headline sentiment score for major manufacturers printed slightly below consensus estimates. Simultaneously, despite central bank communications reflecting an hawkish tilt toward eventual monetary policy normalization, market participants viewed the immediate pace of Bank of Japan rate hikes as too gradual to bridge the substantial yield gap. Consequently, the yen underperformed as yield differentials remained the dominant cross-border flow driver.
Institutional capital flows and calendar-related positioning further amplified the pair's trajectory. Quarter-start portfolio rebalancing and corporate hedging activity spurred solid demand for U.S. dollar assets, while market participants adjusted exposures ahead of key macroeconomic releases later in the week. Over the medium term, USDJPY remains closely anchored to broader U.S. bond yield dynamics and monetary policy divergence, with investors continually evaluating whether economic data support a broader structural trend or temporary rangebound adjustments.
Technical Analysis of USD/JPY (USDJPY)
Technically, USD/JPY (USDJPY) shows a MACD (12,26,9) value of 0.625, indicating a neutral signal. The RSI at 54.335 suggests neutral condition and the Williams %R at 17.564 suggests overbought condition. Please monitor closely.
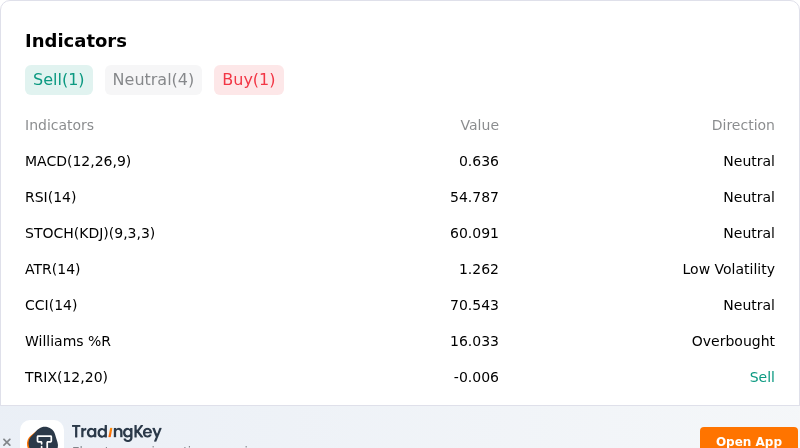
More details about USD/JPY (USDJPY)
Recent Events and Risks:
- Heightened Foreign Exchange Intervention Threat: Escalating verbal warnings from Japan's Ministry of Finance regarding yen weakness, alongside joint messaging with U.S. financial officials, have significantly elevated market fear of direct currency intervention, sparking protective unwinding of long USD/JPY positions.
- U.S. Yield Repricing from Softer Inflation Data: Softer-than-expected U.S. PCE inflation metrics have curbed aggressive Federal Reserve rate expectations, pulling benchmark U.S. Treasury yields lower and compressing the U.S.-Japan interest rate differential to generate intraday downside pressure.
- Hawkish Bank of Japan Outlook and Inflation Pressure: Accelerating inflation measures in Tokyo and continued hawkish signals from Bank of Japan policymakers following recent rate increases maintain expectations for further domestic monetary tightening, curbing investor appetite for yen-funded carry trades.
- Quarter-End Portfolio Rebalancing and Carry Unwinding: Institutional quarter-end portfolio adjustments and aggressive profit-taking below key technical resistance around 158.00 are driving sharp dollar liquidations and heightening near-term downside volatility.
Recommended Articles


