


EUR/USD (EURUSD) Is down 0.61% on Sep 16: Are Market Expectations Adjusting?
EUR/USD (EURUSD) is down 0.61% at Sep 16 14:55(ET), now at $1.1472, with a 7-day down of 1.38%.
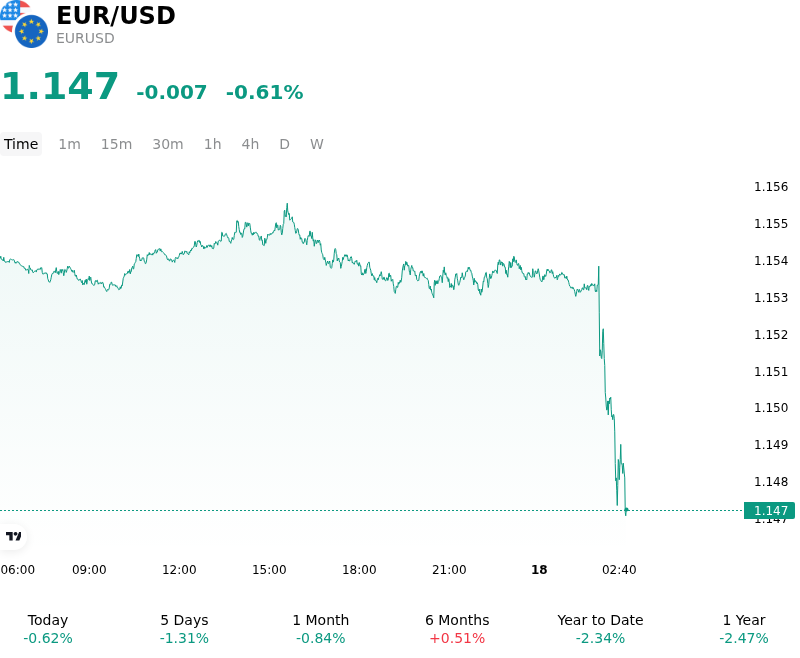
What is driving EUR/USD (EURUSD)’s stock price down today?
The decline in EURUSD was primarily driven by a surge in demand for the US dollar following the Federal Reserve's decision to resume monetary tightening. The Federal Open Market Committee delivered a 25-basis-point interest rate increase, lifting the federal funds target range to 3.75%-4.00%, marking its first policy rate hike since July 2023. Crucially, the updated dot plot and Summary of Economic Projections signaled that another rate hike remains likely before year-end, as sticky core inflation and elevated energy prices keep US price pressures running well above the central bank's target.
This hawkish policy stance triggered a sharp repricing across fixed-income markets, propelling US Treasury yields higher across the curve. With the 10-year US Treasury yield hovering near multi-decade highs around 5.0%, short-term and long-term interest-rate differentials widened substantially in favor of the US dollar. In addition, surging crude oil prices driven by geopolitical tensions in the Middle East bolstered US inflation expectations while dampening global risk appetite, prompting additional safe-haven capital allocation into greenback-denominated assets.
Conversely, the euro underperformed against its major counterpart as European macroeconomic fundamentals presented a stark contrast. High energy prices continue to impose a heavier tax on the Eurozone economy, aggravating stagflation risks and limiting the European Central Bank's capacity to keep pace with hawkish Fed rate hikes. The resulting monetary policy divergence underscores structural downside pressures on the single currency.
From a structural perspective, the downward move in EURUSD reflects broader macro fundamentals rather than a transient market reaction. As long as rate differentials favor the dollar and energy-driven inflation remains a persistent threat, the euro will likely face ongoing headwinds. Investors will remain focused on upcoming US economic data, energy market volatility, and subsequent central bank commentary to evaluate whether the dollar's momentum can be sustained into the fourth quarter.
Technical Analysis of EUR/USD (EURUSD)
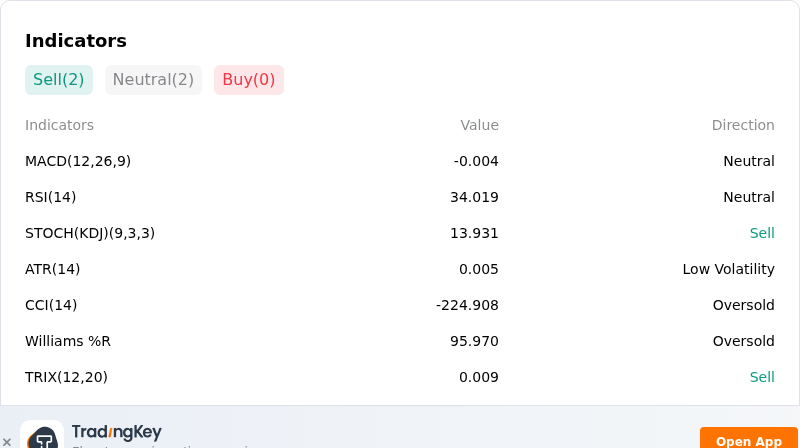
Technically, EUR/USD (EURUSD) shows a MACD (12,26,9) value of -0.004, indicating a neutral signal. The RSI at 34.613 suggests neutral condition and the Williams %R at 92.907 suggests oversold condition. Please monitor closely.
More details about EUR/USD (EURUSD)
Recent Events and Risks:
- Federal Reserve Hawkish Shift and Strong U.S. Data: Sticky U.S. inflation data alongside a surprisingly strong August retail sales surge (+1.2% MoM) have cemented expectations for Federal Reserve rate hikes and a hawkish dot-plot trajectory, driving the U.S. Dollar higher and keeping EUR/USD under persistent pressure near one-month lows around 1.1530.
- Middle East Energy Shock and Eurozone Stagflation Exposure: Escalations in Middle East conflict driving Brent crude oil above $105 per barrel present severe asymmetric downside risk to the energy-dependent Eurozone economy, fueling stagflation fears and souring regional sentiment surveys.
- Widening Sovereign Yield Differentials: U.S. 10-year Treasury yields pushing above 5.0% contrast with Eurozone benchmark yields near 4.0%, significantly expanding the yield differential in favor of the Greenback and incentivizing capital flows away from the single currency.
- Fading Support from ECB Tightening Amid Weak Growth: Although the European Central Bank raised its deposit rate to 2.50%, President Lagarde's strong emphasis on data dependency alongside contracting Eurozone industrial output has muted Euro buying, leaving the pair exposed to downside technical breakdowns toward key support at 1.1500.
Recommended Articles


