


WTI (USOIL) Drops on Sep 16: What Lie behind the Move?
WTI (USOIL) is down 2.00% at Sep 16 03:05(ET), now at $101.185, with a 7-day up of 5.98%.
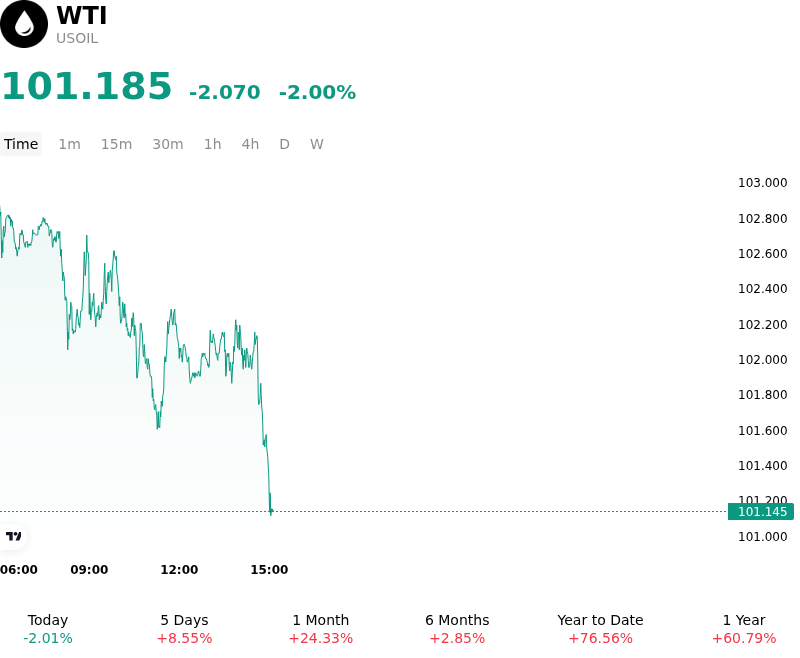
What is driving WTI (USOIL)’s stock price down today?
Crude oil prices experienced a pullback as market sentiment was burdened by an unexpected surge in domestic crude inventories. Weekly industry inventory data revealed a substantial crude stockpile build of over seven million barrels, starkly contrasting market expectations for a draw. Surpluses across refined products, including gasoline and distillate inventories, added further downward pressure on near-term market balances. This sudden domestic inventory accumulation alleviated immediate physical tight-market concerns within North American hubs, prompting energy traders to reassess short-term supply-demand dynamics.
The downside movement was accelerated by technical profit-taking following a multi-session rally that had pushed crude benchmarks to multi-month highs. Investors trimmed long exposure to lock in gains after reports indicated potential short-term timelines for resuming flows through key Middle Eastern export infrastructure, even as broader geopolitical tensions in the region persisted. The temporary easing of immediate pipeline escalation risks encouraged market participants to focus on domestic supply builds rather than lingering international export bottlenecks.
Broader macroeconomic headwinds and capital flow rebalancing ahead of the Federal Reserve policy decision further tempered institutional risk appetite. Cautious positioning across commodity derivatives capped buying interest, steering market sentiment toward a temporary structural consolidation. While global long-term balance outlooks remain constrained by elevated geopolitical risk premiums, short-term price action reflects an event-driven recalibration toward burgeoning domestic inventories and pre-central bank policy adjustments.
Technical Analysis of WTI (USOIL)
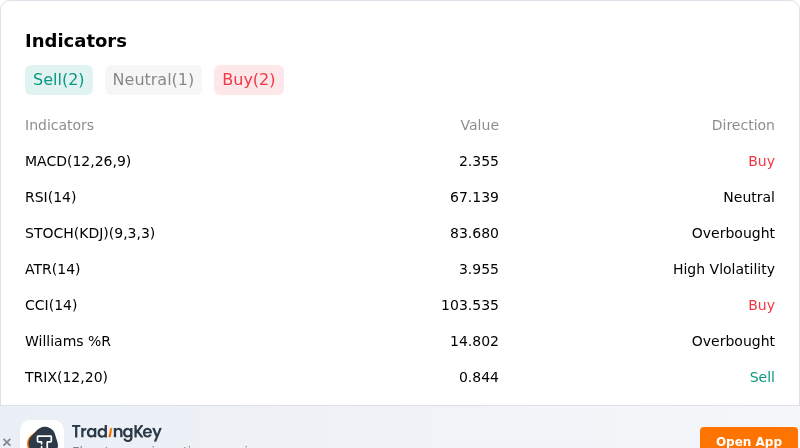
Technically, WTI (USOIL) shows a MACD (12,26,9) value of 2.355, indicating a buy signal. The RSI at 67.139 suggests neutral condition and the Williams %R at 14.802 suggests overbought condition. Please monitor closely.
More details about WTI (USOIL)
Recent Events and Risks:
- Unexpected U.S. Crude Inventory Build: Industry data from the American Petroleum Institute reported a surprise surge of over 7.1 million barrels in U.S. crude stockpiles for the week ending September 11, sharply defying consensus expectations for a 1.6 to 1.8 million barrel drawdown and triggering immediate intraday downside pressure on WTI futures.
- Major Global Energy Agency Demand Downgrades: Consecutive Monthly Oil Market Reports from both OPEC and the International Energy Agency trimmed 2026 global oil demand growth forecasts, pointing to ongoing industrial demand weakness, sluggish middle-distillate consumption, and contracting Asian petrochemical demand as key structural headwinds.
- Hawkish Policy Expectations and Dollar Strength: Firming expectations of tighter Federal Reserve monetary policy and elevated real interest rates have driven the U.S. Dollar Index toward multi-week highs, increasing foreign buyer costs for dollar-denominated USOIL contracts and fueling cross-asset risk-off liquidation.
- Near-Record Domestic Production and Transitory Supply Mitigation: U.S. domestic crude production maintaining near-record levels of roughly 13.95 million barrels per day, alongside official indications that temporary Middle East pipeline bypass disruptions may be resolved swiftly, raises the risk of a sharp unwinding of geopolitical risk premiums if supply routes normalize.
Recommended Articles


