


Ferguson Enterprises Inc Stock (FERG) Moved Down by 3.00% on Sep 15: Key Drivers Unveiled
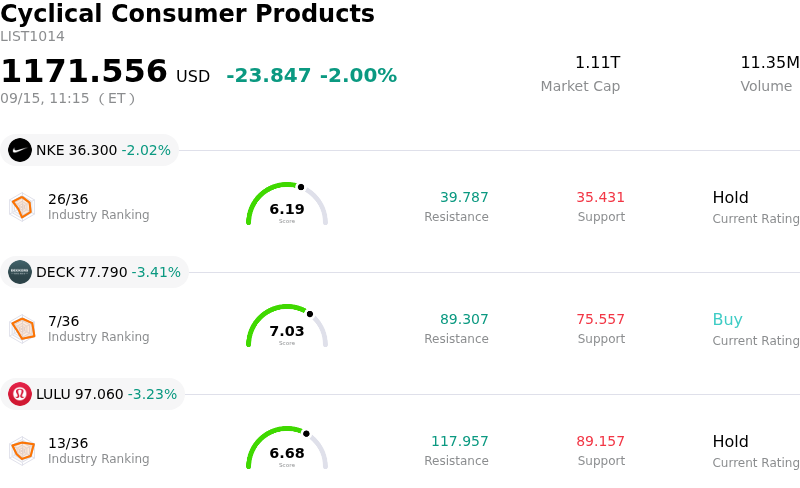
Ferguson Enterprises Inc (FERG) moved down by 3.00%. The Cyclical Consumer Products sector is down by 2.00%. The company underperformed the industry. Top 3 stocks by turnover in the sector: Nike Inc (NKE) down 2.02%; Deckers Outdoor Corp (DECK) down 3.35%; Lululemon Athletica Inc (LULU) down 3.23%.
What is driving Ferguson Enterprises Inc (FERG)’s stock price down today?
Ferguson Enterprises faced downward equity pressure as market sentiment was weighed down by sell-side analyst action and conservative initiation reports. Wolfe Research initiated coverage on the company with a neutral rating, opting for a cautious outlook compared to earlier market consensus. This neutral commentary reinforced recent target price reductions from major financial institutions, where concerns regarding valuation multiples and near-term market catalysts have dampened institutional enthusiasm. Despite past guidance revisions and robust long-term positioning, cautious commentary from research desks led to heightened intraday trading volatility and selling pressure.
Macroeconomic headwinds across North American building materials and industrial distribution markets continue to weigh on investor sentiment. Softness in residential construction and muted repair, maintenance, and improvement demand have created an ongoing drag on core operations. While non-residential demand and large capital project bidding remain relatively resilient, market participants remain focused on gross margin dynamics. Timing of supplier price increases and recent margin compression, alongside increased working capital requirements to support growth, have made investors sensitive to profitability trends amid an uncertain economic backdrop.
Investor cautiousness also reflects digestion of major corporate actions, including the sizable acquisition of FloWorks International and associated leverage increases. Although strategic bolt-on deals expand Ferguson’s addressable market in technical flow-control solutions, higher debt load and elevated working capital investments have constrained near-term cash generation. Coupled with broader pullbacks across the industrial distribution sector, these fundamental and structural factors drove today's negative stock movement. Institutional investors have largely adopted a wait-and-see stance pending clearer evidence of residential market recovery and seamless integration of recent acquisitions.
Technical Analysis of Ferguson Enterprises Inc (FERG)
Technically, Ferguson Enterprises Inc (FERG) shows a MACD (12,26,9) value of -2.109, indicating a sell signal. The RSI at 34.391 suggests neutral condition and the Williams %R at 100.000 suggests oversold condition. Please monitor closely.
Media Coverage of Ferguson Enterprises Inc (FERG)
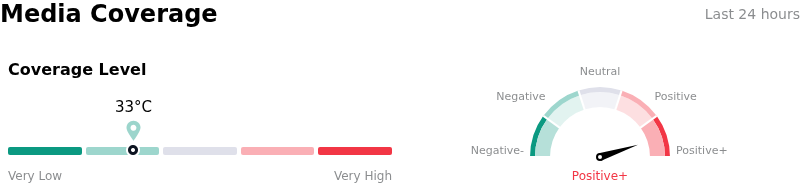
In terms of media coverage, Ferguson Enterprises Inc (FERG) shows a coverage score of 33, indicating a low level of media attention. The overall market sentiment index is currently in extremely bullish zone.
Fundamental Analysis of Ferguson Enterprises Inc (FERG)
Ferguson Enterprises Inc (FERG) is in the Cyclical Consumer Products industry. Its latest annual revenue is $12.83B, ranking 6 in the industry. The net profit is $786.00M, ranking 8 in the industry. Company Profile
Over the past month, multiple analysts have rated the company as Buy, with an average price target of $285.89, a high of $325.00, and a low of $204.56.
More details about Ferguson Enterprises Inc (FERG)
Company Specific Risks:
- Institutional Analyst Hesitation: Wolfe Research initiated coverage on Ferguson with a cautious "Peer Perform" rating, reflecting market concerns over valuation limits and sluggish revenue growth in key end-markets.
- Persistent Residential Sector Softness: Prolonged weakness across U.S. residential construction and RMI (repair, maintenance, and improvement) sectors continues to restrain organic volume growth and exert pressure on top-line performance.
- Gross Margin Compression: Fading inflationary pricing tailwinds and competitive pricing dynamics have caused a 20-basis-point gross margin contraction to 31.0%, threatening profitability if top-line growth decelerates.
- Debt Expansion and Elevated Interest Expenses: Following $1.2 billion in senior unsecured note issuances to finance M&A activity such as the FloWorks acquisition, the company expects interest expenses to reach approximately $200 million for 2026, increasing balance sheet leverage in a high-rate environment.
Recommended Articles


