


Shopify Inc Stock (SHOP) Moved Down by 3.13% on Aug 17: Drivers Behind the Movement
Shopify Inc (SHOP) moved down by 3.13%. The Software & IT Services sector is down by 2.41%. The company underperformed the industry. Top 3 stocks by turnover in the sector: Microsoft Corp (MSFT) down 3.17%; Meta Platforms Inc (META) down 3.63%; Alphabet Inc Class A (GOOGL) down 0.82%.
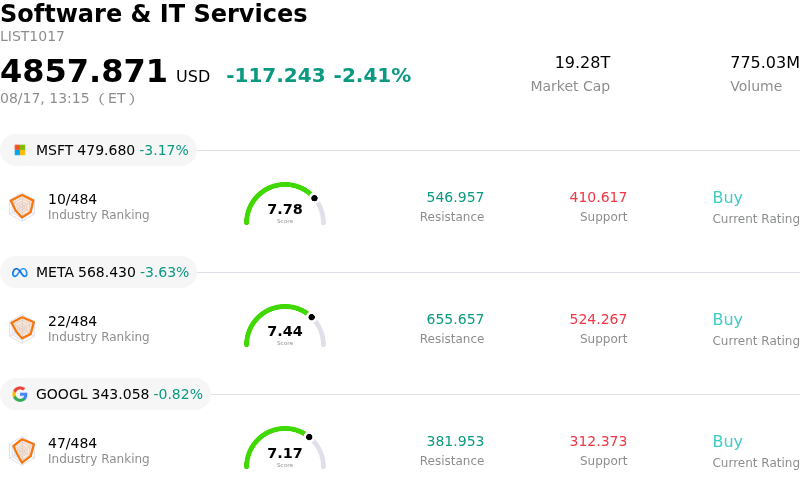
What is driving Shopify Inc (SHOP)’s stock price down today?
Shopify experienced price weakness and notable intraday volatility following an analyst rating downgrade and routine profit-taking after a substantial post-earnings rally. The primary catalyst behind today's downward pressure was a broker downgrade to a more neutral stance, driven by valuation considerations after the equity surged in recent sessions following its strong second-quarter earnings release. While the company's recent quarterly performance and forward guidance comfortably beat Wall Street estimates, the rapid share price appreciation left valuation multiples stretched relative to cash flow projections, prompting institutional investors to reduce exposure and capture short-term gains.
Fundamentally, investor sentiment reflects a balance between robust top-line momentum and underlying margin trends. Shopify continues to demonstrate operational strength through solid Gross Merchandise Volume expansion and deeper adoption of its payment and checkout ecosystem. However, recent financial disclosures highlighted slight margin compression resulting from a revenue mix shift toward lower-margin merchant solutions, coupled with rising capital commitments toward artificial intelligence and large language model capabilities. These cost dynamics have led research analysts to trim near-term price targets or lower investment ratings despite lifting full-year revenue and profit forecasts.
Trading dynamics were further amplified by elevated volatility as momentum traders and automated strategies reacted to the shifting analyst consensus. The sudden shift from aggressive buying to profit-taking generated swing activity during the trading session. Over the medium term, Shopify remains well-positioned within the evolving digital commerce landscape, supported by expanding agentic commerce capabilities and market share gains. Nevertheless, in the immediate future, the stock is navigating a period of valuation consolidation as market participants digest recent performance and evaluate the long-term return on its technology investments.
Technical Analysis of Shopify Inc (SHOP)
Technically, Shopify Inc (SHOP) shows a MACD (12,26,9) value of 5.173, indicating a buy signal. The RSI at 66.755 suggests neutral condition and the Williams %R at 10.436 suggests overbought condition. Please monitor closely.
Fundamental Analysis of Shopify Inc (SHOP)
Shopify Inc (SHOP) is in the Software & IT Services industry. Its latest annual revenue is $11.56B, ranking 32 in the industry. The net profit is $1.23B, ranking 39 in the industry. Company Profile
Over the past month, multiple analysts have rated the company as Buy, with an average price target of $169.64, a high of $220.00, and a low of $110.00.
More details about Shopify Inc (SHOP)
Company Specific Risks:
- Analyst Downgrade Driven by Valuation Strains: Phillip Securities downgraded Shopify from Buy to Accumulate on August 17, 2026, citing that recent rapid share price appreciation has capped near-term upside potential despite strong underlying quarterly performance.
- Gross Margin Compression From Product Mix Shift: Gross margins contracted 90 basis points year-over-year due to accelerated growth in lower-margin Merchant Solutions and payment processing relative to higher-margin Subscription Solutions.
- Escalating AI and LLM Operational Expenses: Profitability and operating performance face headwinds from increasing expenditures tied to deploying artificial intelligence features and large language model (LLM) infrastructure across merchant products.
- Elevated Multiple and Profit-Taking Vulnerability: Trading at a premium valuation exceeding 80 times forward earnings following recent rallies, the stock trades above intrinsic valuation metrics, leaving it susceptible to intraday profit-taking.
Recommended Articles


