


WTI (USOIL) Is up 2.30% on Aug 14: Is the Market Repricing It?
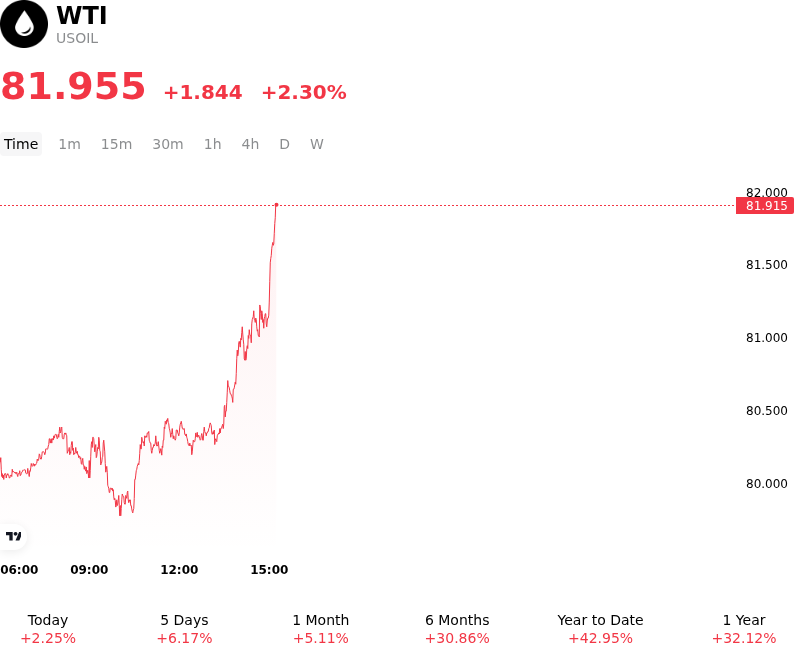
WTI (USOIL) is up 2.30% at Aug 14 03:15(ET), now at $81.955, with a 7-day up of 7.82%.
What is driving WTI (USOIL)’s stock price up today?
West Texas Intermediate crude oil prices advanced as market focus pivoted back toward supply-side security and persistent geopolitical friction in key Middle Eastern transit corridors. Following a brief sell-off in the previous session driven by inventory reporting and softer demand growth projections, energy markets quickly re-absorbed the risk premium associated with ongoing disruptions along the Strait of Hormuz and Bab el-Mandeb. The lack of progress in diplomatic negotiations to guarantee unhindered commercial shipping underscored the fragility of regional supply flows, prompting market participants to reprice short-term physical availability.
Underpinning the move is an increasingly tight medium-term physical balance, reinforced by recent updates from the U.S. Energy Information Administration. Although short-term domestic inventory figures showed localized fluctuations, broader global stock draws and lingering regional production shut-ins continue to keep commercial inventories below historical averages. Strong international demand for U.S. crude exports has further restricted domestic surplus accumulation, ensuring that commercial stocks remain sensitive to any external supply shock. With key energy agencies pointing to persistent constraints on transits through crucial maritime choke points, the broader structural deficit in physical crude continues to lend strong fundamental support to energy prices.
Institutional positioning contributed to the upward momentum as algorithmic strategies and dip-buying capital re-entered the market near key technical support levels. The rebound reflects a tactical shift away from macro demand concerns toward micro-level tightness in prompt physical delivery. Looking ahead, institutional market participants continue to balance short-term supply disruptions against potential medium-term demand revisions from major international energy organizations. Key risks monitored by investors include the timeline for maritime route normalization, potential shifts in OPEC+ output policies, and macroeconomic developments influencing global industrial fuel consumption.
Technical Analysis of WTI (USOIL)
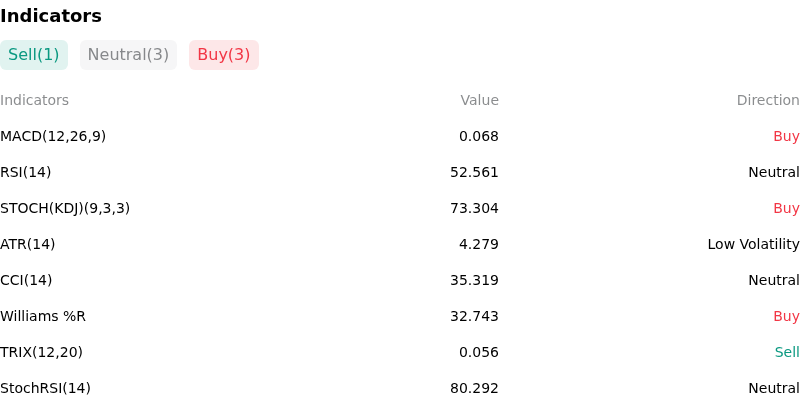
Technically, WTI (USOIL) shows a MACD (12,26,9) value of 0.068, indicating a buy signal. The RSI at 52.561 suggests neutral condition and the Williams %R at 32.743 suggests buy condition. Please monitor closely.
More details about WTI (USOIL)
Recent Events and Risks:
- Surge in U.S. Commercial Inventories: The U.S. Energy Information Administration reported an unexpected 17.4 million-barrel build in commercial crude oil stocks, representing the largest single-week accumulation since January 2023 and defying market expectations of a 1.4 million-barrel draw.
- IEA Demand Contraction Forecast: The International Energy Agency downgraded its global oil market outlook, projecting world demand to contract by 1.6 million barrels per day in 2026 as prolonged high fuel prices and economic headwinds trigger severe demand destruction.
- OPEC Global Demand Growth Downgrade: OPEC slashed its 2026 global oil demand growth forecast for the fourth consecutive month to 580,000 barrels per day from 780,000 barrels per day, highlighting weaker consumption and industrial slowdowns across developed economies.
- U.S. Production Highs and Export Slump: Elevated U.S. domestic crude production holding near 13.8 million barrels per day, coupled with a sharp drop in weekly U.S. export volumes, is aggravating domestic oversupply risks and driving stock builds across Gulf Coast storage hubs.
Recommended Articles


