


Home Depot Inc Stock (HD) Closed Down by 3.02% on Aug 12: Key Drivers Unveiled
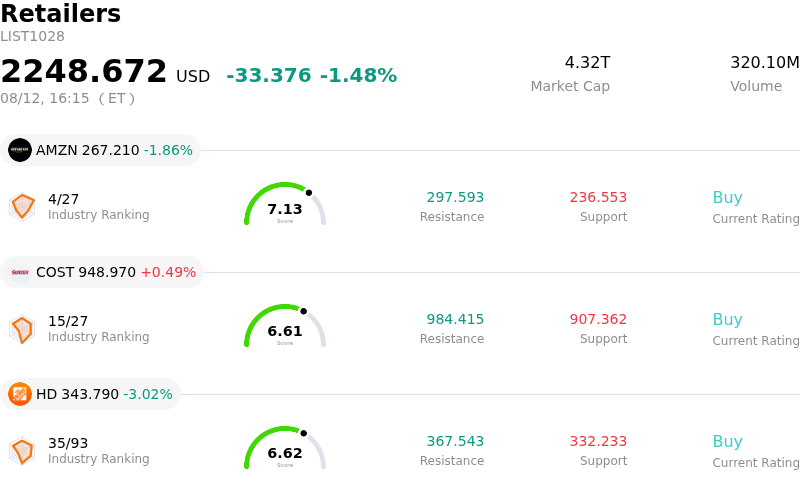
Home Depot Inc (HD) closed down by 3.02%. The Retailers sector is down by 1.48%. The company underperformed the industry. Top 3 stocks by turnover in the sector: Amazon.com Inc (AMZN) down 1.86%; Costco Wholesale Corp (COST) up 0.49%; Home Depot Inc (HD) down 3.02%.
What is driving Home Depot Inc (HD)’s stock price down today?
The primary driver behind the downward movement in Home Depot stock was an unexpected corporate announcement regarding its executive leadership. The company disclosed that its Chairman, President, and Chief Executive Officer would be taking an immediate, temporary medical leave of absence. While the board promptly established an interim leadership structure by assigning daily operations and financial management to veteran executive officers, the sudden temporary departure created an unexpected vacuum at the top, prompting investors to price in administrative uncertainty.
This leadership transition arrived at a particularly sensitive time, occurring just days prior to the company's scheduled second-quarter earnings disclosure. Market participants were already navigating an intricate industry environment characterized by elevated mortgage rates, a sluggish housing turnover, and cautious consumer spending on major home renovation projects. The sudden shift in executive oversight right before the quarterly financial release heightened concerns regarding strategic execution and potential guidance revisions, causing traders to reduce exposure ahead of the earnings report.
The heightened caution triggered institutional repositioning and broader selling across the stock. Because Home Depot maintains a substantial weighting across major benchmark indices and consumer discretionary sector funds, early selling pressure likely triggered automated rebalancing and liquidity adjustments from passive ETF flows. The confluence of executive uncertainty, impending earnings risk, and broader sector headwinds ultimately fueled intraday volatility and pushed the shares lower.
Technical Analysis of Home Depot Inc (HD)
Technically, Home Depot Inc (HD) shows a MACD (12,26,9) value of 3.358, indicating a buy signal. The RSI at 59.452 suggests neutral condition and the Williams %R at 10.988 suggests overbought condition. Please monitor closely.
Media Coverage of Home Depot Inc (HD)
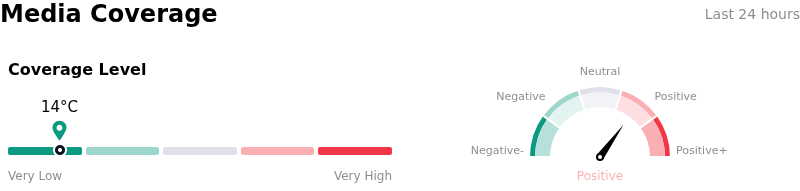
In terms of media coverage, Home Depot Inc (HD) shows a coverage score of 14, indicating a very low level of media attention. The overall market sentiment index is currently in bullish zone.
Fundamental Analysis of Home Depot Inc (HD)
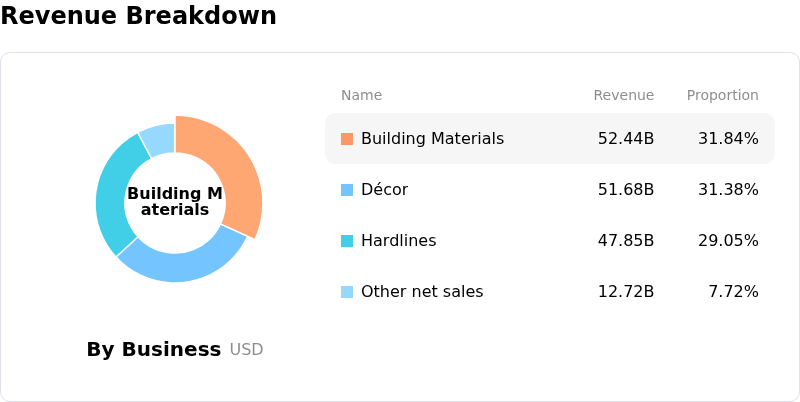
Home Depot Inc (HD) is in the Retailers industry. Its latest annual revenue is $164.68B, ranking 1 in the industry. The net profit is $14.16B, ranking 1 in the industry. Company Profile
Over the past month, multiple analysts have rated the company as Buy, with an average price target of $370.57, a high of $430.00, and a low of $260.00.
More details about Home Depot Inc (HD)
Company Specific Risks:
- Abrupt Leadership Transition and CEO Medical Leave: Home Depot filed a Form 8-K disclosing that Chair, President, and CEO Ted Decker has taken an immediate temporary medical leave of absence. Disclosed just six days prior to the Q2 FY2026 earnings release, the sudden departure introduces unexpected executive transition risk and operational uncertainty during a critical investor reporting window.
- Pre-Earnings Negative Revision Skew and Valuation Pressure: Ahead of the August 18 earnings print, analyst sentiment has trended negatively with 19 downward EPS revisions over the past 90 days. With the stock trading at a premium valuation of approximately 25x P/E, any earnings or revenue shortfall relative to consensus expectations ($4.73 EPS on $47.27 billion revenue) poses immediate downside risk.
- Fragile FY2026 Guidance Dependent on Weather and Storm Rebound: Management's full-year comparable store sales guidance of flat-to-2% growth relies heavily on assumed second-half acceleration driven by normalized storm activity rather than fundamental organic recovery in retail demand. Persistent macroeconomic headwinds, including elevated mortgage rates and weak existing-home turnover, increase the risk of a guidance cut if storm-related sales fail to materialize.
- Integration and Execution Risks in Pro Segment Acceleration: The company's ongoing organizational realignment to unify operations under the Office of Pro Acceleration and integrate acquisitions like SRS and GMS exposes Home Depot to operational execution friction. Managing complex commercial integrations and targeted cross-sell goals during top-level management turnover creates heightened risk to operating margins.
Recommended Articles


