


Ethereum (ETHUSD) Is down 1.12% on Aug 10: What Do On-Chain Data and Market Sentiment Show?
Ethereum (ETHUSD) is down 1.12% at Aug 10 09:35(ET), now at $1896.81, with a 7-day up of 1.63%.
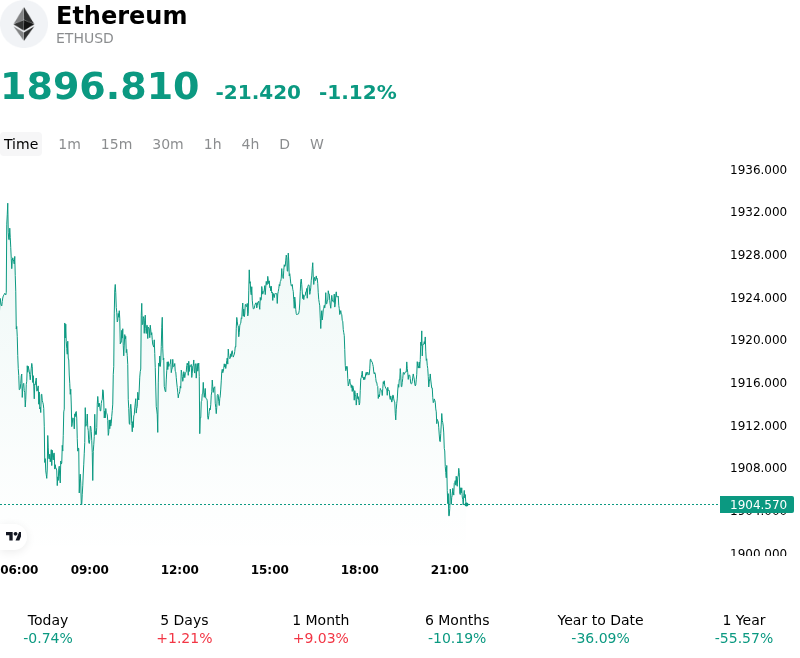
What is driving Ethereum (ETHUSD)’s stock price down today?
The intraday decline in Ethereum reflects a complex interplay between tightening credit conditions and a seasonal liquidity vacuum typical of the August trading window. Market participants are increasingly focused on the divergence between the Federal Reserve’s official policy rate and the long end of the Treasury curve, where the 30-year yield has sustained its position above five percent. This environment, characterized by institutional desks as a shadow tightening, has raised the hurdle rate for duration-sensitive assets, prompting a cautious repricing of Ethereum’s near-term growth premium despite a background of stabilizing on-chain activity.
Investor sentiment is currently navigating a narrative vacuum following the Federal Reserve’s July meeting, which featured an unusually divided committee. The presence of three dissents favoring a rate hike has introduced a level of policy ambiguity that markets have not faced in several years, creating a split signal that complicates the path toward the late-August Jackson Hole symposium. This uncertainty has triggered a modest reduction in risk exposure, particularly as the broader technology sector faces valuation reassessments driven by higher long-term interest rates. The resulting drag on Ethereum highlights its persistent correlation with high-beta equities during periods of macro-driven liquidity contraction.
Institutional participation through spot Ethereum ETFs remains a structural tailwind, with recent data showing five consecutive weeks of net inflows into major regulated vehicles. However, these steady capital commitments were insufficient to offset the intraday selling pressure as the market reopened for the week. The lack of immediate protocol-level catalysts has left the asset vulnerable to the August liquidity trap, where thin trading volumes from vacationing market participants amplify price sensitivity to marginal capital outflows. While corporate treasury activity among major publicly traded holders continues to validate the long-term institutional thesis, the immediate market focus has shifted toward defensive positioning in the face of rising real yields.
On-chain metrics provide a somewhat more resilient backdrop, as exchange-held supply continues to reach multi-year lows, suggesting that the current volatility is largely driven by derivatives positioning and short-term liquidity repricing rather than systemic spot selling. Nevertheless, the combination of a resilient US dollar and the absence of clear forward guidance from central bank officials has created a challenging tactical environment. Investors remain focused on whether the current consolidation will hold or if the continued pressure from the Treasury market will force a deeper re-evaluation of the risk-on narrative heading into the final weeks of the third quarter.
Technical Analysis of Ethereum (ETHUSD)
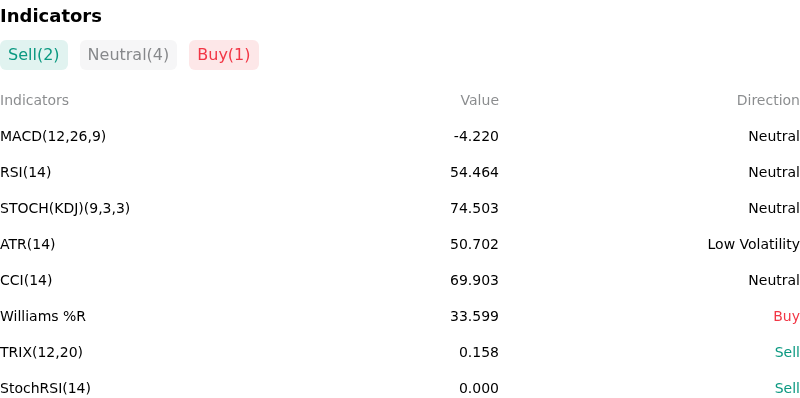
Technically, Ethereum (ETHUSD) shows a MACD (12,26,9) value of -4.220, indicating a neutral signal. The RSI at 54.464 suggests neutral condition and the Williams %R at 33.599 suggests buy condition. Please monitor closely.
More details about Ethereum (ETHUSD)
Recent Events and Risks:
- Spot ETF Net Outflows: Recent trading data shows significant net outflows from newly launched spot Ethereum ETFs, specifically driven by Grayscale (ETHE) exits, creating a persistent supply overhang that challenges intraday price stability.
- Whale and Foundation Transfers: On-chain monitoring has identified substantial ETH movements from the Ethereum Foundation and high-net-worth "whale" wallets to major exchanges within the last 48 hours, increasing the probability of large-scale spot market selling.
- Regulatory Pressure on Staking: Renewed legal scrutiny and potential enforcement actions targeting "staking-as-a-service" providers introduce a specific jurisdictional risk that could force institutional investors to exit ETH positions to avoid non-compliance.
- Derivative Market Overheating: A rapid increase in ETH-denominated open interest alongside high funding rates suggests a buildup of directional leverage, leaving the market vulnerable to a "long squeeze" and cascading liquidations if price action fails to sustain current levels.
Recommended Articles


