


Solana (SOLUSD) Is up 1.11% on Aug 7: Key Drivers to Watch
Solana (SOLUSD) is up 1.11% at Aug 7 05:35(ET), now at $72.66, with a 7-day up of 0.99%.
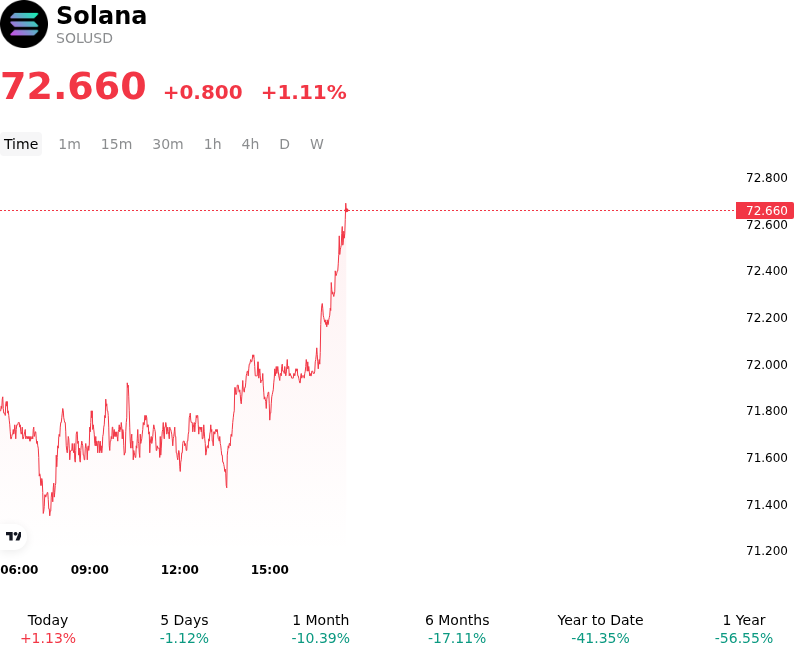
What is driving Solana (SOLUSD)’s stock price up today?
Solana’s price action reflects a robust recovery in institutional appetite, likely spurred by positive net inflows into spot Solana ETPs and a stabilization in global liquidity conditions. The intraday volatility suggests a successful defense of key support levels, as institutional buyers capitalized on early session weakness to accumulate positions. This rotation into Solana highlights its status as a preferred high-beta alternative to Bitcoin and Ethereum, particularly as market participants seek exposure to high-throughput blockchain infrastructure.
The underlying strength is further supported by record-breaking on-chain activity, specifically within the decentralized physical infrastructure and payments sectors. Increased utilization of the Solana network, bolstered by the full integration of the Firedancer validator client, has enhanced network resilience and lowered latency, attracting further enterprise-grade development. This fundamental growth provides a structural floor for the asset, decoupling it from broader speculative movements in the altcoin market.
From a macro perspective, the advance coincides with a softening in the U.S. Dollar Index and a slight contraction in the 10-year Treasury yield. As the Federal Reserve’s monetary policy trajectory becomes clearer, investors are increasingly comfortable moving further out on the risk curve. The heightened volatility observed today also suggests a significant clearing of leveraged short positions in the derivatives market, leading to a gamma-driven push higher as market makers rehedged their exposures.
Despite the positive momentum, investors remain focused on the regulatory landscape surrounding digital asset staking rewards and potential shifts in global risk sentiment. The ability of the network to maintain its performance during periods of extreme volume continues to be a primary metric for long-term allocators. For now, the combination of strong spot demand and improving macro liquidity remains the dominant driver of Solana’s upward trajectory.
Technical Analysis of Solana (SOLUSD)
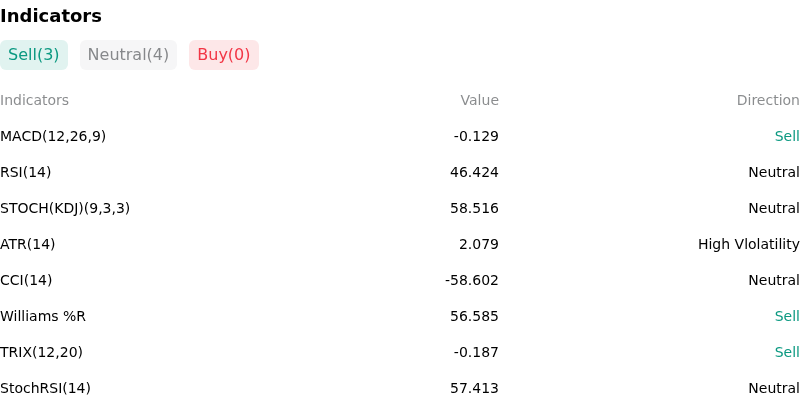
Technically, Solana (SOLUSD) shows a MACD (12,26,9) value of -0.129, indicating a sell signal. The RSI at 46.424 suggests neutral condition and the Williams %R at 56.585 suggests sell condition. Please monitor closely.
More details about Solana (SOLUSD)
Recent Events and Risks:
- Regulatory Security Classification: The SEC’s ongoing litigation against major centralized exchanges continues to explicitly categorize Solana (SOL) as an unregistered security, creating a persistent legal overhang that differentiates its regulatory path from Bitcoin and Ethereum and hampers the immediate likelihood of a spot SOL ETF.
- Supply Overhang and Whale Liquidations: On-chain monitoring of FTX-related estate wallets reveals ongoing movements of previously locked tokens toward exchange deposit addresses, maintaining a consistent source of potential selling pressure that can suppress price recovery during periods of thinning order book depth.
- Network Congestion and Execution Risk: Despite recent software patches, the network remains susceptible to transaction failures and increased latency during high-volume meme coin launches, which threatens to trigger localized liquidity traps for decentralized finance (DeFi) users and algorithmic traders during market stress.
- High-Beta Liquidation Sensitivity: Solana’s significant open interest in the perpetual futures market combined with its high-beta profile relative to Bitcoin makes it uniquely vulnerable to rapid deleveraging events, where a broader market risk-off move can trigger a disproportionate cascade of long liquidations.
Recommended Articles


