


XRP (XRPUSD) Fluctuated Significantly on Aug 7: Key Variables Behind the Move
XRP (XRPUSD) is down 1.21% at Aug 7 00:00(ET), now at $1.0208, with a 7-day down of 3.87%.
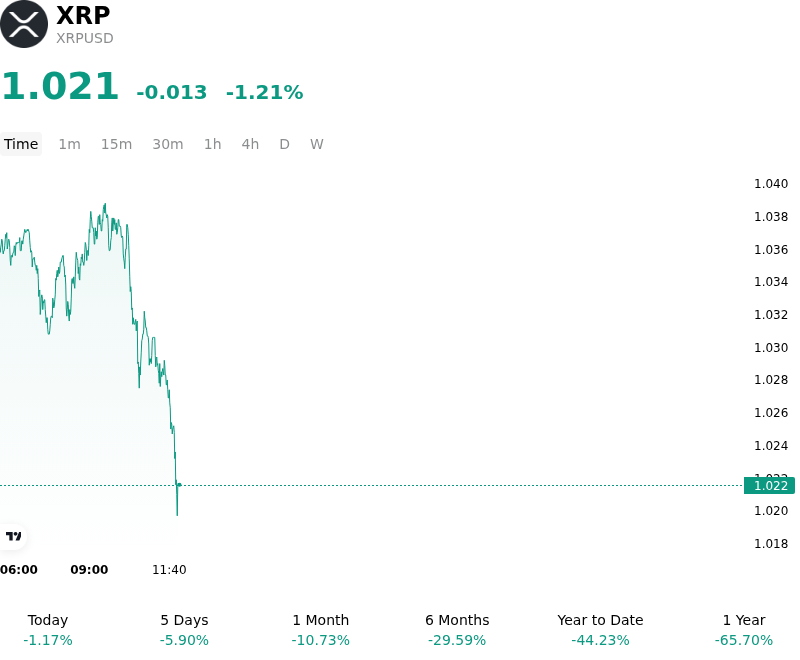
What is driving XRP (XRPUSD)’s stock price down today?
The intraday weakness in XRP is primarily attributed to a broader recalibration of risk across the digital asset complex following the release of the U.S. non-farm payrolls data. As the first Friday of August, the labor market report likely prompted a defensive move in the fixed-income markets and a subsequent appreciation of the U.S. dollar. For XRP, which maintains a sensitive correlation to global liquidity conditions, the resulting rise in Treasury yields has increased the opportunity cost of holding non-yielding assets, leading to a tactical reduction in exposure among institutional desks.
Beyond the macro backdrop, the price action reflects a period of consolidation following recent speculative interest in the Ripple-led stablecoin ecosystem and cross-border payment integrations. Market participants appear to be taking profits as the initial momentum surrounding institutional pilots on the XRP Ledger begins to normalize. This shift is evidenced by a slight increase in exchange-bound on-chain transfers from large-scale holders, suggesting a pivot toward liquidity preservation amid uncertainty regarding the Federal Reserve’s upcoming policy trajectory.
In the derivatives market, the decline was exacerbated by a modest wave of long liquidations in the perpetual futures segment. Open interest had been building on the expectation of a bullish breakout, but the failure to reclaim key psychological resistance levels triggered automated sell orders. This deleveraging event, while orderly, has temporarily dampened short-term sentiment, shifting the focus back to the fundamental utility of the network rather than speculative catalysts.
Furthermore, the absence of fresh regulatory clarity or significant updates regarding a potential spot XRP ETF has allowed the market to drift lower in a low-conviction environment. While institutional interest in the XRP Ledger’s DeFi capabilities remains a long-term structural tailwind, the current lack of immediate catalysts has left the asset vulnerable to broader market volatility. Investors remain focused on capital flows into existing digital asset investment products and the evolving landscape of programmable finance as they gauge the next directional move for the asset.
Technical Analysis of XRP (XRPUSD)
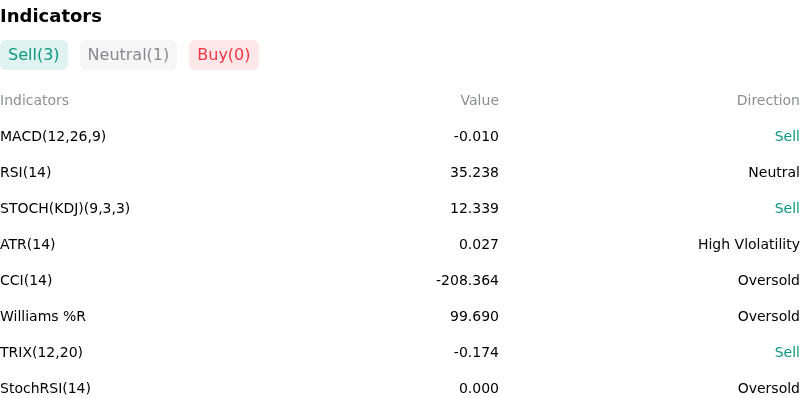
Technically, XRP (XRPUSD) shows a MACD (12,26,9) value of -0.010, indicating a sell signal. The RSI at 35.238 suggests neutral condition and the Williams %R at 99.690 suggests oversold condition. Please monitor closely.
More details about XRP (XRPUSD)
Recent Events and Risks:
- Regulatory Penalty Uncertainty: The ongoing legal battle between Ripple and the SEC remains a primary risk factor, as the regulator's pursuit of nearly $2 billion in fines and penalties in the remedies phase creates massive financial uncertainty and potential downward pressure on price as the final judgment looms.
- Heightened Whale Exchange Inflows: On-chain data from the last 48 hours indicates significant transfers of XRP to centralized exchanges, including movements of over 60 million tokens to Bitstamp and Bitso, suggesting that large-scale holders are positioning for potential liquidations or hedging against near-term price drops.
- Technical Support Weakness and Liquidation Risk: XRP is currently struggling to maintain support levels at the $0.50 mark, and a failure to hold this threshold could trigger a cascade of stop-loss orders and liquidations for leveraged long positions, potentially accelerating a move toward the $0.46 support zone.
- Declining Institutional Sentiment: Relative to Bitcoin and Ethereum, XRP has seen a marked slowdown in institutional capital inflows and spot-demand growth, leading to thinner liquidity and making the asset more vulnerable to sharp, intraday volatility spikes driven by broader market risk-off sentiment.
Recommended Articles


