


BNB (BNBUSD) Is down 1.04% on Aug 6: What Do On-Chain Data and Market Sentiment Show?
BNB (BNBUSD) is down 1.04% at Aug 6 14:35(ET), now at $589.4, with a 7-day down of 0.22%.
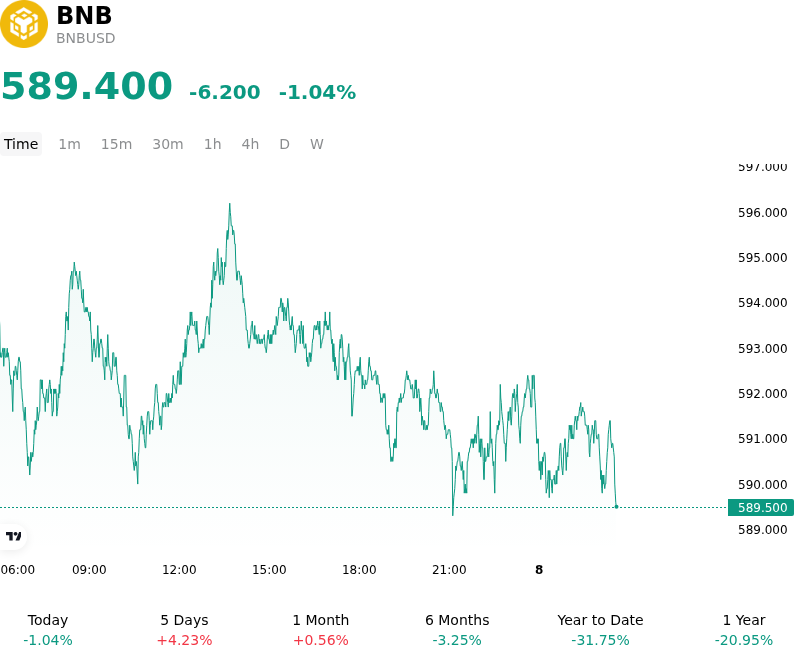
What is driving BNB (BNBUSD)’s stock price down today?
The softening in BNB valuation is primarily reflective of a broader tightening in global liquidity conditions as market participants re-evaluate Federal Reserve policy trajectories. With Treasury yields showing resilience and the US dollar experiencing a tactical bid, appetite for high-beta digital assets has moderated. This macro-driven risk-off sentiment often impacts exchange-linked tokens first, as they serve as proxies for broader retail and institutional trading activity across the digital asset market.
Within the Binance ecosystem, the intraday volatility suggests a temporary consolidation following a period of heightened activity in decentralized finance and Launchpool participation. On-chain metrics indicate a stabilization in transaction fees and active addresses, leading some short-term traders to rotate capital into emerging Layer-2 solutions or alternative store-of-value assets. This rotation typically occurs when the immediate catalysts for BNB utility, such as new project stakings or ecosystem incentives, enter a brief hiatus, reducing the immediate demand for the token.
From a technical and derivatives perspective, the price action points toward a cleanup of over-leveraged long positions in the perpetual futures market. As funding rates began to skew heavily positive earlier in the week, a slight downward move triggered a series of automated liquidations, exacerbating the intraday fluctuations. Institutional participants remain focused on the long-term regulatory clarity surrounding the exchange and its global compliance framework, treating these minor pullbacks as liquidity-driven adjustments rather than structural shifts in the asset's fundamentals.
Investors continue to monitor the balance between the burn mechanism's deflationary pressure and the overall volume on the BNB Chain. Regulatory developments in major jurisdictions remain a secondary but persistent factor, as any shift in the perceived risk profile of the underlying exchange platform often translates into immediate price volatility. The current trend suggests a market that is highly sensitive to both global macro liquidity and the specific utility-driven demand cycles within the Binance ecosystem.
Technical Analysis of BNB (BNBUSD)
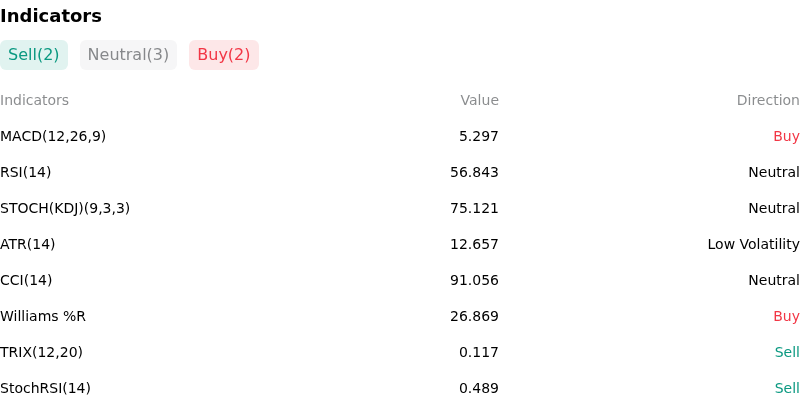
Technically, BNB (BNBUSD) shows a MACD (12,26,9) value of 5.297, indicating a buy signal. The RSI at 56.843 suggests neutral condition and the Williams %R at 26.869 suggests buy condition. Please monitor closely.
More details about BNB (BNBUSD)
Recent Events and Risks:
- Regulatory Litigation Persistence: The ongoing legal battle between the SEC and Binance remains a primary downside catalyst, as the regulator continues to challenge the classification of BNB, maintaining a cloud of uncertainty regarding its long-term status on regulated trading platforms.
- Post-Launchpool Liquidation Pressure: The conclusion of recent farming cycles on the Binance Launchpool, such as the Scroll (SCR) distribution, has historically led to immediate sell pressure as market participants unwind BNB positions used for yield generation, contributing to intraday price retracements.
- Heightened Open Interest and Liquidation Risk: Recent increases in BNB perpetual futures open interest suggest a buildup of leverage; a failure to sustain the $600 psychological level could trigger a cascade of long liquidations, particularly if broader market sentiment remains fragile.
- Centralization and Whale Concentration: On-chain data indicates a high concentration of BNB within exchange-controlled wallets, meaning any unexpected regulatory action against Binance or large-scale transfers by "whales" to spot markets can cause disproportionate price volatility due to concentrated supply.
Recommended Articles


