


Bitcoin (BTCUSD) Is down 1.11% on Aug 3: What Are the Risk Factors?
Bitcoin (BTCUSD) is down 1.11% at Aug 3 01:00(ET), now at $62762.57, with a 7-day down of 3.34%.
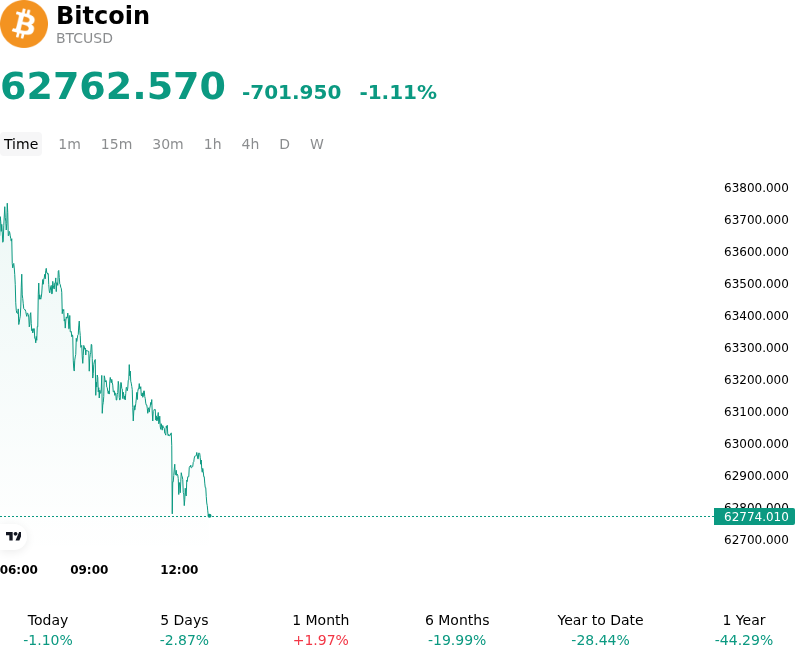
What is driving Bitcoin (BTCUSD)’s stock price down today?
Bitcoin’s downward trajectory during the session reflects a recalibration of risk-on sentiment as global liquidity conditions tighten in response to shifts in US Treasury yields. The primary catalyst appears to be a resurgence in the US Dollar Index, driven by stronger-than-anticipated economic data that has prompted a hawkish repricing of the Federal Reserve’s terminal rate expectations for the remainder of 2026. As yields on the 10-year Treasury note climbed, the opportunity cost of holding non-yielding digital assets increased, triggering a modest reduction in institutional exposure.
Institutional participation, primarily through spot Bitcoin ETFs, showed signs of exhaustion following several weeks of sustained inflows. The shift toward net outflows in the leading US-domiciled funds suggests that large-scale allocators are moving into a defensive posture, awaiting clearer signals on the global inflation trajectory. This institutional cooling has dampened the buy-side pressure that previously supported Bitcoin above key technical levels, leading to a breakdown in short-term support.
On-chain activity supports a narrative of cautious distribution. A notable increase in exchange-inflow mean suggests that mid-sized holders and short-term speculators are moving assets to centralized platforms, likely to hedge against further downside volatility. Furthermore, the derivatives market experienced a localized flush of long positions. High funding rates in the perpetual swap market prior to the move indicated an overheated speculative environment, making the price sensitive to even minor bearish catalysts.
Regulatory uncertainty also continues to weigh on the broader digital asset ecosystem. Market participants remain attentive to ongoing legislative discussions regarding stablecoin reserves and the oversight of decentralized finance protocols. While these developments are structural in nature, the lack of definitive clarity serves as a persistent drag on risk appetite, preventing a sustained breakout during periods of macro-driven volatility.
The current price action represents a tactical retreat rather than a fundamental breakdown of the store-of-value narrative. However, the sensitivity to the US dollar and interest rate swaps highlights Bitcoin’s growing correlation with traditional risk assets. Investors are now monitoring the interplay between M2 money supply growth and corporate treasury activity as the market seeks a new equilibrium.
Technical Analysis of Bitcoin (BTCUSD)
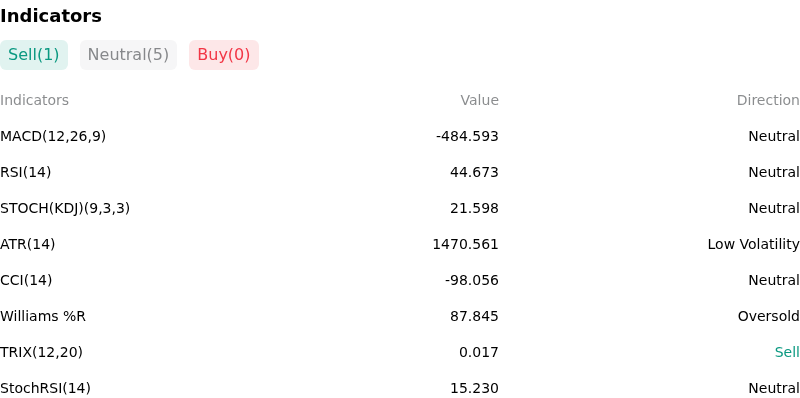
Technically, Bitcoin (BTCUSD) shows a MACD (12,26,9) value of -484.593, indicating a neutral signal. The RSI at 44.673 suggests neutral condition and the Williams %R at 87.845 suggests oversold condition. Please monitor closely.
More details about Bitcoin (BTCUSD)
Recent Events and Risks:
- ETF Net Outflow Contagion: Recent trading sessions have seen a sharp reversal in institutional demand, with U.S. spot Bitcoin ETFs recording over $465 million in net outflows, signaling a pivot in sentiment that threatens to break the established $63,000 support floor and accelerate selling pressure.
- Legislative and Regulatory Stall: The stalling of the Digital Asset Market Clarity Act ahead of the August congressional recess, coupled with declining passage probabilities on prediction markets, has removed a major bullish catalyst and introduced fresh uncertainty regarding near-term market structure and institutional compliance.
- Macro-Geopolitical Risk Correlation: Rising energy prices driven by escalating Middle Eastern conflict have reignited inflation fears, leading to hawkish expectations for the Federal Reserve's next policy moves and causing a breakdown in Bitcoin's resilience against traditional risk-off assets.
- Liquidity and Accumulation Decay: On-chain metrics reveal that stablecoin inflows to exchanges have reached multi-year lows, indicating an exhaustion of immediate buying power and "dry powder," which leaves the market highly susceptible to downside volatility and cascading liquidations.
Recommended Articles


